Market Bubble Analysis & Commentary
Daily commentary on the speculative excesses, valuation extremes, and structural risks shaping global markets right now. Articles cover equities, property, crypto, commodities, and the macro forces that drive boom-and-bust cycles, with frequent reference to historical parallels documented in the encyclopedia. Each piece is written to translate complex market signals into clear, actionable context for long-term investors.
Analysis falls into four recurring categories — historical-parallel pieces that map a current market condition onto a documented past bubble; crypto-market-cycle notes that track halving positioning, stablecoin reserves, and exchange-concentration risk; property-market-risk pieces that examine credit availability, household debt, and rental-yield gaps; and global-market-risk articles that focus on yield-curve signals, central-bank divergence, and sovereign-debt sustainability. The category badge on each card identifies which lens the article uses.
Every article is written to a strict editorial standard. Specific numbers must be traceable to live indicator data or supplied source text. Speculative phrasing is avoided. Articles below an 800-word threshold are rejected and regenerated. Pieces flagged for review are held back rather than published with disclaimers. Use this feed to track how today's risks are evolving and where the next mania may already be forming.
The pipeline that produces these articles draws on a structured set of inputs: a daily-refreshed table of macro indicators (Shiller CAPE, Buffett Indicator, US 10-year yield, MOVE index, Bitcoin dominance, stablecoin reserves, household debt-to-GDP, and roughly forty others), a curated news feed scraped from central-bank statements, regulatory filings, and major financial outlets, and the full encyclopedia of historical bubbles for parallel-matching. The model is instructed to flag any indicator reading that crosses a documented historical threshold and to anchor its analysis in that signal rather than in sentiment or narrative.
Editorial independence matters. Bubblepedia does not accept sponsored placements inside analysis articles, and affiliate links — where they appear — are confined to clearly labelled blocks separated from the body copy. We do not short or hold leveraged positions in any asset discussed, and we do not publish price targets or trade recommendations. The goal is structural understanding: helping readers recognise the shape of a bubble before it bursts, and the shape of a recovery before it begins. Bookmark this page or subscribe to the weekly digest to follow the analysis as it evolves.

SpaceX Drives US Share Sales to $251 Billion at Midyear — and 1929's Buyer Profile Is Staring Back at Us
As US equity issuance hits a record $251 billion at the 2026 midyear mark, the composition of buyers — retail investors, pension allocators, and momentum-chasing institutions — mirrors the democratised speculation that characterised the final phase of the 1920s bull market before
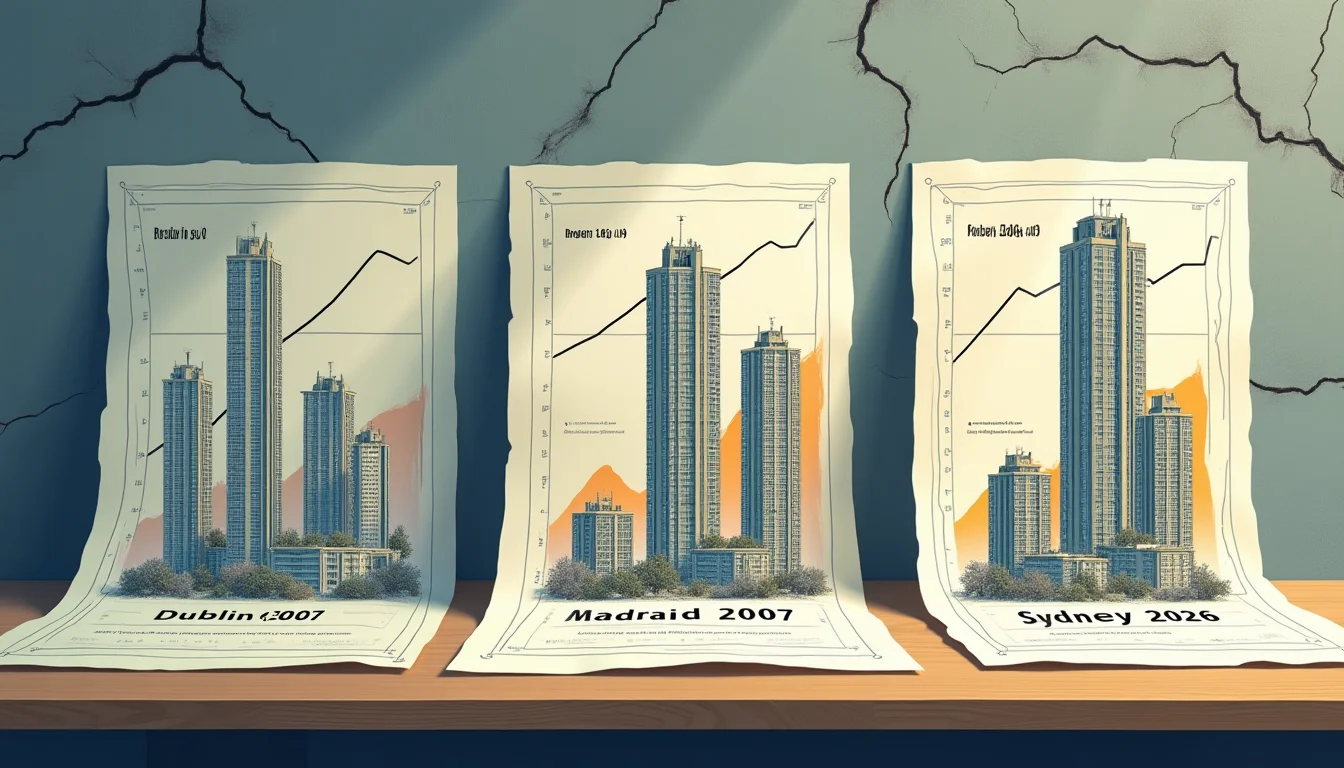
Construction Booms & Crashes: Ireland 2006, Spain, Australia 2022
When construction activity swells to represent an outsized share of national output, history shows the subsequent correction is rarely limited to the building sector — it reshapes entire economies, and Australia's current exposure warrants serious scrutiny.
Geopolitical Ceasefire Relief Masks a Sovereign Debt Reckoning That AI Spending Binges Are Making Worse
As markets price in geopolitical de-escalation and reduced uncertainty, the structural deterioration in sovereign debt sustainability — compounded by government-backed AI infrastructure commitments — is being systematically ignored in a pattern that echoes every major bubble's fi

NFT Market Collapse: How Celebrity-Driven Mania Left Most Collections Worthless and Exposed Regulatory Failures
Three years after NFT trading volumes collapsed by more than 97%, the regulatory and legal fallout from the 2021-2022 mania continues to reshape digital asset law, celebrity liability, and the future of on-chain ownership — at enormous cost to the participants who believed the hy

Australia's Debt Trap: How Household Borrowing Trajectories Preceded Every Major Property Crash Since 1980
Australia's household debt-to-income ratio has followed a trajectory that closely mirrors the pre-crash patterns seen in Japan, Ireland, and the United States — raising serious questions about the sustainability of current property valuations.

Kevin Warsh's Fed Debut Meets a Fracturing Dollar Regime — and the Megacap Bubble That Depends on It
As incoming Fed Chair Kevin Warsh steps onto the global monetary stage, the dollar's role as anchor of currency intervention regimes worldwide is under stress in ways that could unwind the AI megacap valuations propping up global equity indices.

Borrowed Belief: How Margin Debt and Synthetic Leverage Inflated — Then Detonated — the 2020-2022 Crypto Bubble
The 2020-2022 crypto bubble was not merely a story of speculative enthusiasm — it was an architecture of borrowed money, rehypothecated collateral, and algorithmic lending that amplified both the ascent and the catastrophic collapse.

Exchange Concentration Risk: Lessons from 2014, 2016, 2022
Exchange concentration in crypto markets has reached levels that mirror the single-point-of-failure dynamics that destroyed NFT market liquidity in 2022, raising systemic questions about what happens when the dominant venue stumbles.
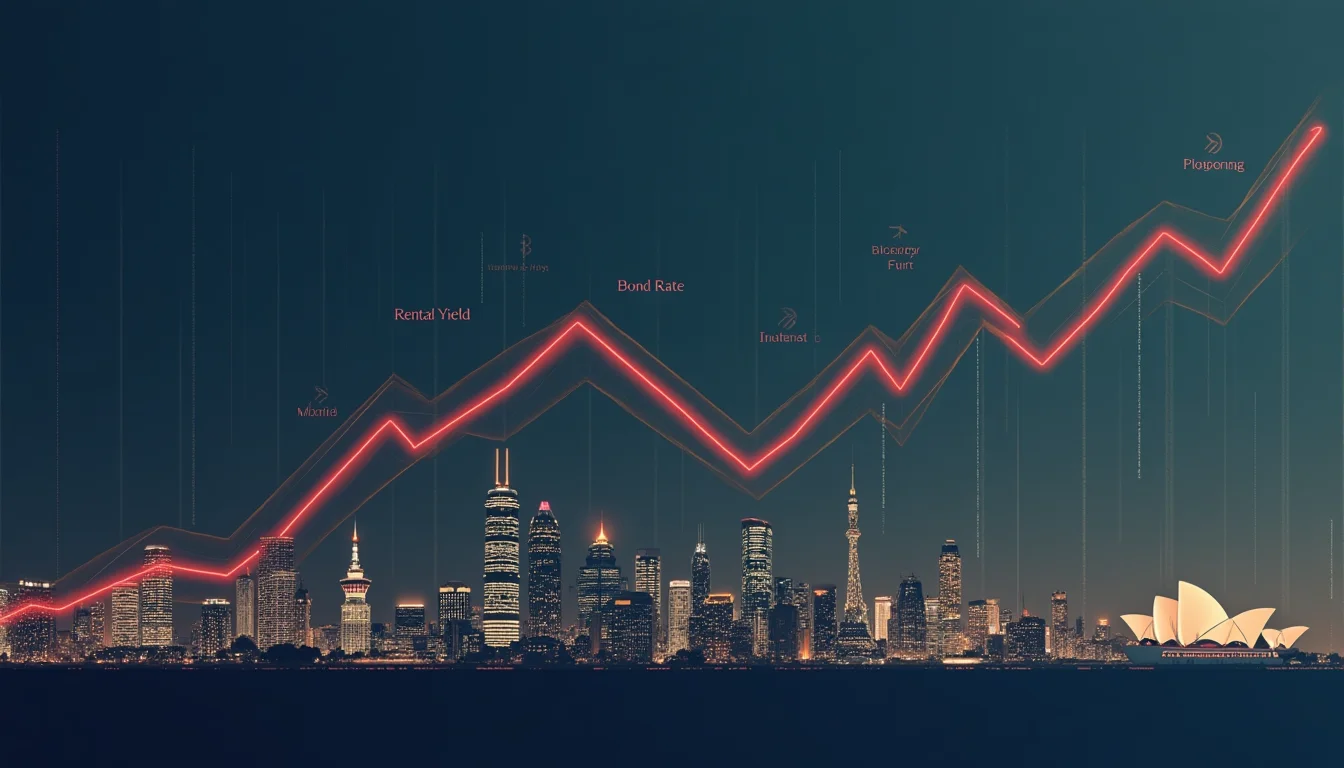
When Property Stops Paying: Yield Compression Before 2008 and 2012
Across four major property crashes — Japan 1991, Sweden 1992, Ireland 2008, and Spain 2012 — a sustained inversion of rental yields below government bond rates preceded the peak by one to three years, a pattern that Australian residential markets are now replicating.

Abby Joseph Cohen Warns on Valuations as Fed-ECB Divergence Echoes the Capital Misallocation of the Telecom Boom
With equity valuations drawing warnings from veteran strategist Abby Joseph Cohen and central banks on divergent policy paths, the conditions for large-scale capital misallocation are gathering in ways that rhyme with the late-1990s telecom mania.

GameStop's Short Squeeze Structure Persists Into 2026
Five years after WallStreetBets drove GameStop from $17 to $483, the structural vulnerabilities that enabled the meme stock squeeze — extreme short interest, gamified retail platforms, and coordinated social media pressure — remain embedded in markets and are reappearing in new a

Credit Turns Trigger Property Crashes: 2008 Ireland Case Study
History from Japan 1990, Sweden 1992, and Ireland 2008 shows that the moment credit availability turns — not the moment rates peak — is when property bubbles begin their most destructive phase.

SpaceX Bonds, 3x AI ETFs, and the Real Innovation Trap: What DeFi Summer Taught Us About Genuine Disruption Becoming Speculative Fuel
SpaceX's debut bond sale and the simultaneous launch of leveraged AI ETFs echo the early stages of DeFi Summer 2020, when genuine financial innovation provided the intellectual cover for increasingly circular and unsustainable yield-chasing.

Bitcoin ETF Inflows Mask a Familiar Divergence: Institutional Accumulation at the Top Has Happened Before
As spot Bitcoin ETFs attract sustained institutional capital, historical bubble patterns — including the meme coin mania of 2021 — warn that professional money entering late in a cycle rarely signals safety; it often signals the final phase of price discovery.

Australia's Net Overseas Migration Has Peaked — and History Shows What Happens to Property Markets Next
When migration-driven demand that inflated property prices during a demographic boom begins to reverse, history from Ireland, Canada, and New Zealand suggests the correction is rarely gradual.

SK Hynix's 12% Single-Day Surge and Thailand's AI Windfall Reveal How Geopolitical Supply Shocks Manufacture Speculative Momentum
A US-listing plan for SK Hynix and Thailand's emergence as Southeast Asia's surprise AI stock winner illustrate how geopolitical supply chain rewiring is concentrating speculative capital into narrow corridors — a dynamic with uncomfortable echoes of the 2021 meme stock frenzy.

Who Was Actually Buying ICO Tokens at the Peak? A Portrait of the 2017 Retail Speculator — and Their 2026 Successors
The 2017 ICO bubble was driven overwhelmingly by retail investors with no due diligence framework buying tokens from anonymous founders — a participant composition that has since been replicated in DeFi yield farming, NFT mints, and meme coins with near-identical results.

Bitcoin Miner Capitulation in June 2026: When Producers Quit, Who Catches the Falling Hash Rate?
Bitcoin miner capitulation signals are intensifying in mid-2026, echoing the post-ICO collapse of 2018 when forced equipment liquidations preceded a prolonged bear market floor.

When Building Becomes the Economy: Construction-GDP Dependency and the Anatomy of Property Crashes
Nations that allow residential construction to absorb an outsized share of GDP consistently face the same reckoning — a structural overcorrection that drags the broader economy down with the housing sector when sentiment turns.

Sovereign Debt Crisis: 2022's Reckoning Arrives in 2026
With the Federal Reserve holding rates elevated, global sovereign debt burdens at historic highs, and equity markets priced near dot-com-era extremes, the conditions for a simultaneous bond and equity market dislocation are more advanced than at any point since 2000.

Pokémon's 30th Anniversary: How 2025-2026 Mirrors 2020-2022 Bubble
The 2025-2026 Pokémon card market is displaying the same credit-driven, sentiment-fuelled speculative architecture that collapsed the original 2020-2022 mania — with modern sealed products posting 176-355% annual price gains and zero fundamental earnings floor to arrest a reversa

Andrew Cuomo's NYSE-Backed Crypto Venture Signals Peak Exchange Concentration — and a DeFi Summer Warning
Former New York Governor Andrew Cuomo is set to lead a crypto venture backed by the New York Stock Exchange's parent company, a development that crystallises deepening exchange-concentration risk in digital asset markets and echoes the single-point-of-failure dynamics that preced
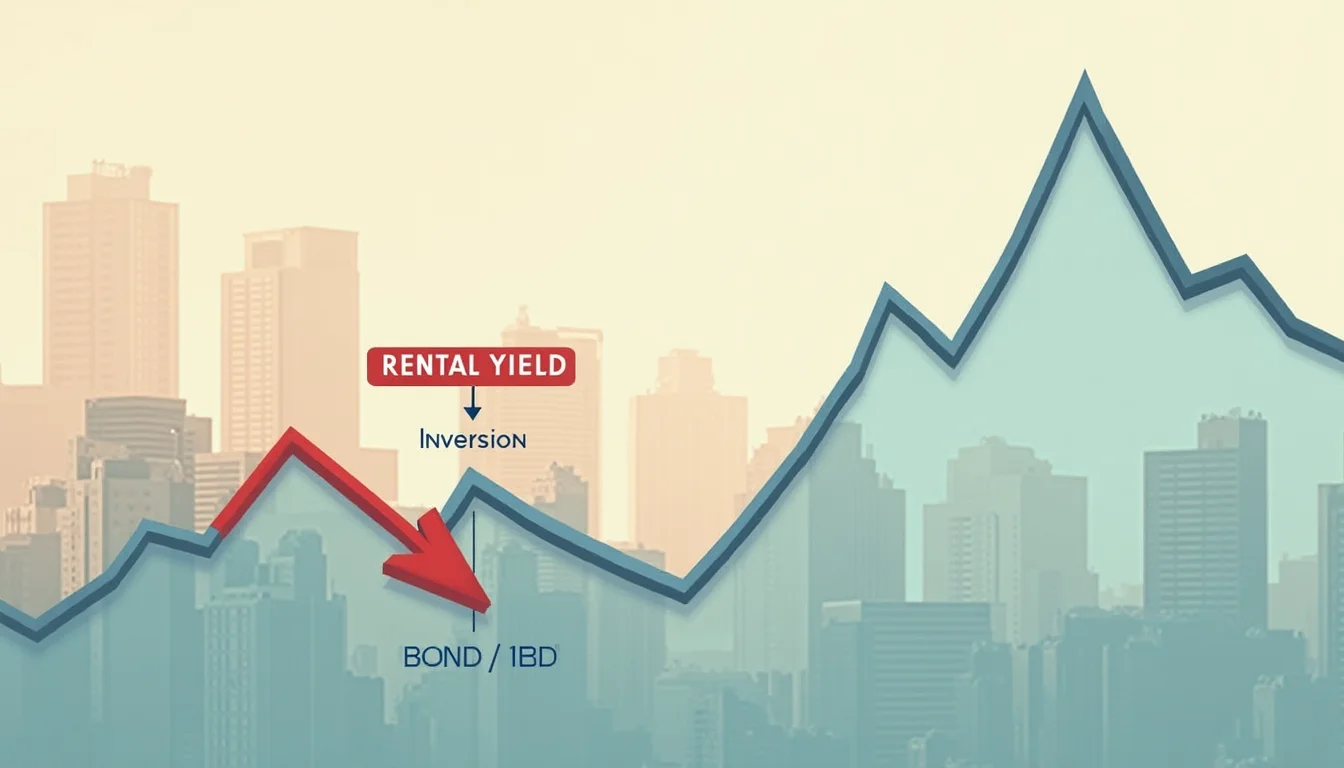
When Rental Yields Fall Below Bond Rates: Australia's 1989 and 2006 Warning
Australia's residential rental yields have compressed to levels where they no longer meaningfully exceed government bond rates, a gap inversion that preceded major property corrections in Japan (1989), Sweden (1990), and Norway (1987).

Chinese Stocks in Hong Kong Near Bear Territory as Fed-ECB Divergence Fragments Global Capital Flows
Hongkong-listed Chinese equities are approaching bear market territory just as a widening Fed-ECB policy gap is redirecting global capital in ways that echo the liquidity dislocations preceding China's catastrophic 2015 stock market crash.