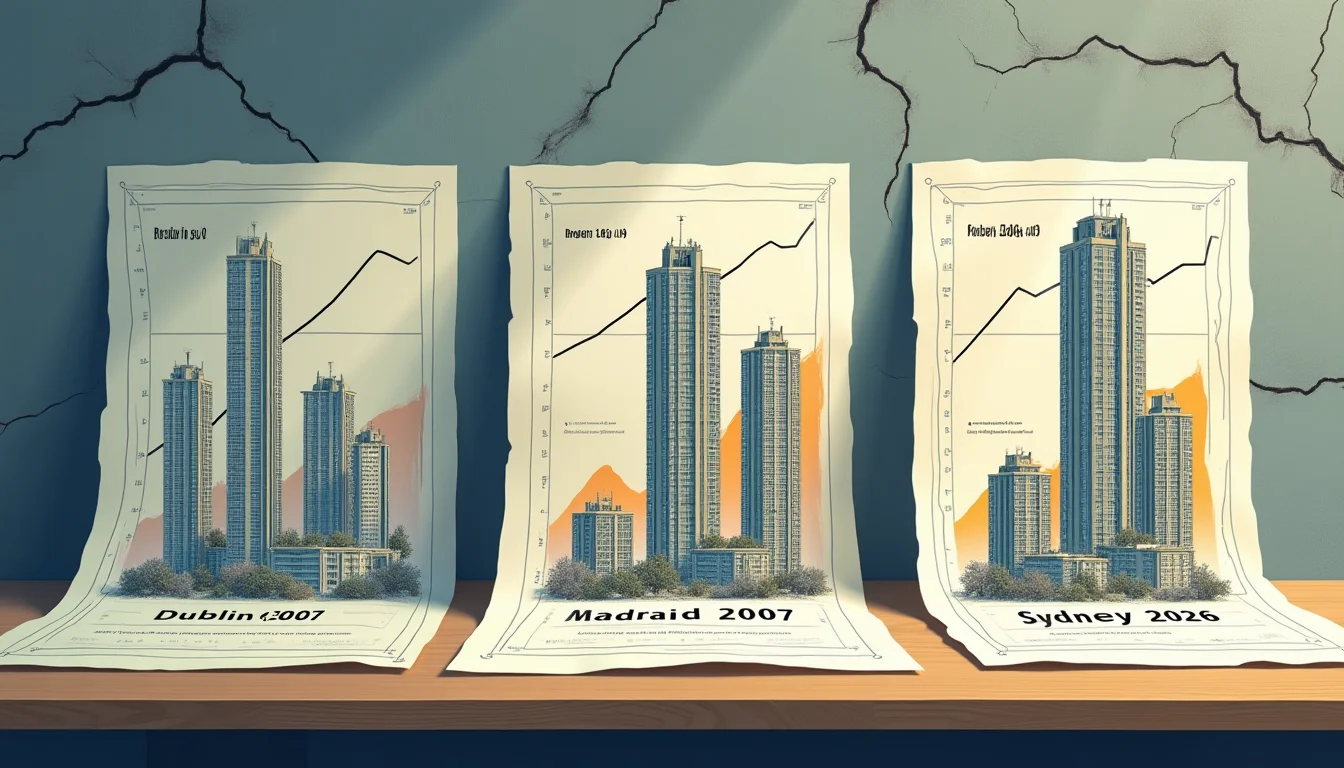
In the years immediately before Ireland's property market collapsed in 2008, construction activity had expanded to represent a significant share of gross domestic product — a proportion that dwarfed the eurozone average and left the broader economy acutely vulnerable when credit conditions tightened. According to the Bubblepedia Irish Property Bubble entry, residential completions peaked at a very high level in 2006 before falling sharply over the following five years. Spain's experience was structurally similar: at the peak of its construction boom, the sector employed a substantial share of the national workforce, and the subsequent correction produced very high unemployment rates by 2012. These are not merely cautionary statistics. They represent a sequencing pattern — construction dependency, credit amplification, correction — that has repeated across economies with enough regularity to constitute a recognisable historical template.
The Anatomy of Construction Dependency
Construction-to-GDP dependency is a deceptively simple metric that captures something profound about an economy's structural vulnerability. When the building sector expands to represent an elevated share of output, several compounding risks emerge simultaneously. First, employment becomes concentrated in an industry whose output is highly sensitive to interest rate movements and credit availability. Second, tax revenues become correlated with transaction volumes and development activity — both of which are among the first casualties of a property downturn. Third, and most consequentially, the political economy of construction dependency creates institutional resistance to the very policy interventions that might moderate the cycle.
Ireland and Spain demonstrated all three dynamics in sequence. In both cases, governments had grown structurally reliant on stamp duties, capital gains taxes, and VAT receipts from construction activity. When transaction volumes fell, fiscal positions deteriorated rapidly — not because of reckless spending, but because revenue bases had been quietly hollowed out during the boom. The Irish government's fiscal surplus of the mid-2000s evaporated almost overnight, revealing what economists later described as a structural deficit that had been masked by cyclical construction revenues.
When an economy's growth path becomes materially dependent on the construction of dwellings rather than on productivity gains or export competitiveness, the correction risk is not confined to property prices — it is embedded in the fiscal architecture itself.
What distinguished Japan's correction from Ireland's and Spain's was the duration rather than the mechanism. All three economies experienced the same fundamental sequence: construction activity expanded well beyond what underlying demographic and productivity fundamentals could sustain; credit conditions tightened; the sector contracted sharply; and the broader economy bore the fiscal and employment consequences for years afterward. For readers interested in how the Japanese episode compares structurally with more recent housing dislocations, the Japanese Property Bubble vs. US Housing 2008 comparison provides a detailed structural analysis.
Australia's Structural Position
Australia's construction sector has been a significant contributor to GDP growth across multiple cycles, and the relationship between residential construction activity and broader economic performance has become increasingly entangled over the past two decades. Infrastructure commitments, state government housing targets, and population-driven demand have all provided political and economic rationales for sustained construction activity. The Australian Bureau of Statistics has consistently recorded construction as one of the larger employing industries in the national economy, and state budgets in New South Wales and Victoria have historically been sensitive to property transaction volumes through stamp duty receipts.
The structural question is not whether Australia's construction sector is currently at the same absolute proportion of GDP as Ireland's was in 2006 — available data do not support a direct equivalence claim. The more relevant question is whether the directional dynamics are comparable: whether fiscal revenues, employment, and credit quality have become sufficiently correlated with property and construction activity that a demand shock would propagate through the broader economy in ways that policymakers may be underestimating. For context on current Australian property market conditions, Australian Property Forum provides ongoing analysis of valuation trends, auction clearance rates, and financing conditions across the major capital cities.
The current policy environment adds a layer of complexity. Interest rates remain elevated relative to the historic lows that prevailed between 2020 and 2022, and the pipeline of approved but not yet commenced dwellings has lengthened in several states, creating uncertainty about whether planned supply will materialise at the scale governments have projected. Construction cost inflation, labour shortages, and builder insolvencies have all featured in recent industry commentary — conditions that historically precede a contraction in activity rather than an expansion.
The Fiscal Feedback Loop
Perhaps the least-discussed risk in construction-dependent economies is the fiscal feedback loop. State governments that have come to rely on stamp duty revenues to fund recurrent expenditure face a structural problem when transaction volumes decline: either services are cut, deficits expand, or both. This is not a hypothetical risk — it is precisely what occurred in Ireland between 2008 and 2012, and it is what drove Spain's sovereign debt crisis into territory that required external intervention.
Australia's states are not in an equivalent fiscal position, and the federal government's capacity to absorb state fiscal stress through grants and transfers provides a buffer that smaller eurozone economies lacked. But the underlying logic of fiscal dependency on property-linked revenues is structurally identical, and the buffer provided by federal transfers has limits that are rarely stress-tested in public debate. Readers seeking a broader view of current bubble risk indicators across asset classes can consult the Bubblepedia Bubble Watch dashboard, which tracks valuation metrics, credit conditions, and sentiment indicators across property, equities, and credit markets.
What History Suggests About Timing
One of the consistent findings from comparative bubble research is that construction-dependent corrections are difficult to time but relatively predictable in their sequencing. The trigger — whether a credit tightening, an external demand shock, or a sentiment shift — is less important than the structural vulnerability that makes the correction severe. Ireland's trigger was the global financial crisis; Spain's was the same; Japan's was deliberate monetary tightening. In each case, the construction dependency amplified the initial shock into a multi-year economic dislocation.
Australia has managed previous property cycles without the kind of systemic correction seen in Ireland or Spain, a fact that is sometimes cited as evidence of structural resilience. A more cautious reading of that history is that Australia has been fortunate in the timing of its cycles — commodity booms, population growth, and the absence of a domestic banking crisis have provided buffers that may not be equally available in the next downturn. The full Bubblepedia bubble encyclopedia documents numerous cases in which a track record of avoided corrections was itself a contributing factor to eventual complacency.
The construction-to-GDP dependency story is ultimately a story about concentration risk — not in a portfolio sense, but in a structural economic sense. When the building of dwellings becomes one of the primary engines of employment, fiscal revenue, and credit growth simultaneously, the economy's exposure to a property correction is no longer confined to the balance sheets of property owners. It is embedded in the architecture of the economy itself.
See also: Australian Property Bubble vs US Housing Bubble 2008 — Why One Crashed and One Did Not.