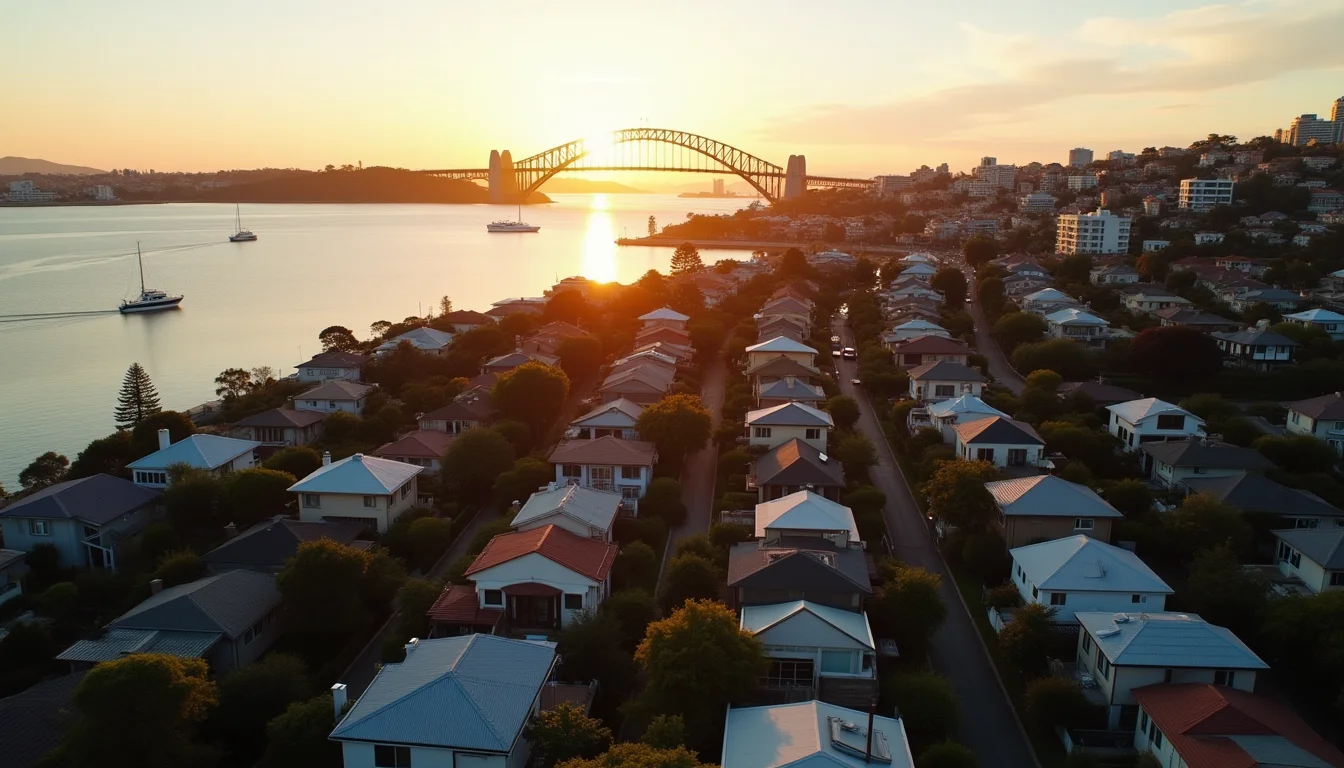
Australian Property — The Longest Bull Run? (1990-Present)
Australian property has not experienced a significant national correction since 1990, creating the longest continuous property bull run in recorded history.
By Twin · @TwinTowerCity·
Key Takeaways
- →Australian property prices have risen continuously for 33 years since 1990, creating the longest recorded property bull run in history.
- →Structural factors including high immigration, supply constraints, full recourse lending, and central bank intervention have sustained price growth beyond traditional fundamentals.
- →Unlike traditional bubbles, Australian property has not experienced a significant national correction or crash to date as of 2024.
- →The absence of a major collapse makes it difficult to quantify traditional bubble damage, though affordability has deteriorated significantly over three decades.
- →Australia's experience suggests that strong structural supports can sustain asset prices far beyond historical norms for extended periods without requiring crashes.
Peak Year
2024
Crash Year
Ongoing
Location
Australia
Asset Class
Real Estate
Severity
Three Decades of Unbroken Growth
Australia's property market has experienced one of the longest sustained price increases in global real estate history. Between 1993 and 2022, median house prices in Sydney rose approximately 800%, from around A$150,000 to over A$1.3 million according to CoreLogic data. Melbourne, Brisbane, and other capital cities followed similar trajectories, though at varying magnitudes. Unlike most developed nations, Australia experienced no significant house price correction during the 2008 global financial crisis — one of only a handful of countries where prices continued rising through the downturn.
Several structural factors underpinned this extraordinary run. Australia's population grew rapidly — from 17.5 million in 1993 to over 26 million by 2023 — driven by one of the developed world's highest immigration rates. Housing supply in major cities was constrained by restrictive zoning, slow planning approvals, and geographic limitations (Sydney is hemmed by national parks, mountains, and ocean). The result was persistent demand-supply imbalance in the most desirable urban markets.
Tax and Credit Incentives
Australia's tax system provided powerful incentives for property investment. Negative gearing — allowing investment property losses to be deducted against wage income — encouraged leveraged speculation. The 50% capital gains tax discount, introduced in 1999, further rewarded long-term property holding. Self-managed superannuation funds were permitted to borrow to purchase property from 2007, channelling retirement savings into the housing market.
Credit availability expanded dramatically. The household debt-to-income ratio rose from approximately 70% in the early 1990s to over 200% by 2022 — among the highest in the developed world, according to the Reserve Bank of Australia (RBA). Interest-only loans, which minimise repayments and maximise leverage, comprised up to 40% of new mortgage lending at their 2015 peak. Lending standards, while tightened after regulatory interventions by APRA (Australian Prudential Regulation Authority) in 2014 and 2017, remained looser than many comparable nations.
Bubble Indicators and Warnings
By multiple measures, Australian housing has exhibited classic bubble characteristics. The median house price-to-income ratio in Sydney reached approximately 13:1 by 2022, compared to a historically sustainable ratio of 3–5:1. The Economist magazine's global property index has repeatedly flagged Australian housing as among the world's most overvalued, estimating 40% or more overvaluation relative to income and rents in major cities.
Rental yields compressed to historic lows — below 2.5% gross in Sydney by 2021 — meaning property investors relied almost entirely on capital gains rather than income returns. The RBA itself acknowledged in multiple Financial Stability Reviews that household leverage and housing valuations posed systemic risks to the Australian financial system, though it stopped short of declaring a bubble.
COVID-Era Surge and Correction
The COVID-19 pandemic initially triggered fears of a housing downturn, but the RBA's emergency rate cut to a record 0.1% in November 2020, combined with fiscal support measures, instead ignited a further surge. National dwelling prices rose approximately 25% in 2021 — the fastest annual increase since the late 1980s. Regional markets outperformed cities as remote work shifted demand patterns.
When the RBA began raising rates aggressively in May 2022 — from 0.1% to 4.35% by November 2023 — prices fell approximately 9% nationally from their April 2022 peak. However, the correction proved shallow and short-lived: by mid-2023, prices were rising again, driven by record immigration (approximately 500,000 net arrivals in 2022–23), chronic housing undersupply, and resilient employment. By early 2024, Sydney and Melbourne had recovered most of their losses.
Current Status and Outlook
Australia's property market remains one of the most watched potential bubble cases globally. Household debt remains among the world's highest, affordability is at historic lows, and the market's resilience through multiple global shocks has led some analysts to question whether traditional bubble metrics apply to Australia's unique conditions. Others argue the market is sustained primarily by immigration-driven demand and constrained supply rather than speculation, and that a correction will require either a significant recession or a sustained period of real price stagnation. Whether Australia's property market represents a bubble or a structurally justified premium remains one of the most contested questions in global real estate economics.
For Australian investors considering international property diversification in response to domestic bubble risk, Wise offers mid-market exchange rates for international property deposits and settlements — significantly cheaper than standard bank international wire fees.
The Six Property Cycles Since Federation
Australian property has experienced six identifiable major cycles since Federation in 1901. The post-WWI boom of 1919-1924 was driven by demobilisation, soldier settlement schemes, and a brief surge in commodity prices. It ended in regional collapses that foreshadowed the broader Depression. The 1929-1933 collapse saw urban property prices fall by 30 to 50 percent in real terms across major capitals, with Sydney and Melbourne both experiencing prolonged declines.
The post-WWII suburban expansion from 1945 through the late 1960s was the longest period of sustained price appreciation in modern Australian history, driven by the baby boom, mass European immigration, and the construction of the suburban infrastructure (highways, schools, power) that defined modern Australian cities. The 1970s inflation hedge cycle saw nominal property prices double in many cities between 1972 and 1974 as households sought protection from accelerating consumer price inflation. The early-1990s recession produced sharp corrections in commercial property and significant declines in residential prices, particularly in Melbourne, where commercial overbuilding combined with the broader recession to produce a regional banking crisis.
The sixth and longest cycle — uninterrupted residential price appreciation from 1996 through 2017 — was the most consequential. Sydney median house prices rose approximately 600 percent in nominal terms over the period, with Melbourne, Brisbane, and Perth experiencing similar trajectories at slightly different timings. The combination of demand-side tax incentives, sustained immigration, falling interest rates, and credit expansion produced the largest sustained property boom in Australian history.
The Structural Factors That Differentiate Australian Property
Australian property's persistent appreciation through the late twentieth and early twenty-first centuries reflects specific policy settings rather than any natural law of housing economics. Negative gearing, introduced in 1985, allowed investors to deduct rental property losses against unrelated employment income. The Hawke government briefly removed the concession in July 1985, observed that Sydney rents rose approximately 20 percent over the following two years (a result subsequently disputed by economists who attributed most of the rise to other factors), and reinstated negative gearing in September 1987. The reinstatement set a political precedent: every subsequent attempt to reform negative gearing has failed at the federal level.
The Howard government's 1999 introduction of a 50 percent capital gains tax discount on assets held more than twelve months transformed the after-tax economics of property investment. The combination of negative gearing on the holding period and the 50 percent CGT discount on disposal produced an investment vehicle whose tax treatment was significantly more favourable than the equivalent investment in productive enterprise.
The Australian Prudential Regulation Authority's macroprudential interventions of 2015 (caps on investor lending growth) and 2017 (limits on interest-only lending) demonstrated that supply of credit, not supply of housing, had been the binding constraint on prices through the cycle. Both interventions produced immediate price moderation in the markets they targeted.
When credit conditions tighten, Australian property prices fall promptly. When credit conditions loosen, they rise promptly. The notion that prices are determined primarily by housing supply rather than mortgage availability is unsupported by the evidence of any cycle in the past forty years.
The Affordability Crisis Timeline
Sydney's median dwelling price-to-household-income ratio rose from approximately 4 in the early 1990s to above 9 by 2022. Melbourne's ratio followed a similar trajectory. The intergenerational wealth transfer dimension became politically central: existing homeowners experienced large unrealised capital gains, while first home buyers found deposits requiring 8 to 10 years of saving even on above-median incomes.
The Reserve Bank of Australia's cash rate cycle from May 2022 (when rates began rising from 0.10 percent) to November 2023 (peak at 4.35 percent) produced the fastest tightening cycle since the early 1990s recession. National dwelling prices fell approximately 9 percent peak-to-trough through 2022 before stabilising and recovering through 2023. The cycle confirmed both the sensitivity of Australian property to interest rates and the limited extent to which prices would correct in the absence of either a recession or sustained credit tightening.
The Bubble Question
The academic debate over whether Australian property constitutes a bubble has been sustained for two decades without resolution. Bubble theorists, including economist Steve Keen and former Treasury official Saul Eslake, have argued that price-to-income, price-to-rent, and household debt-to-income ratios have reached levels that imply substantial overvaluation and require eventual correction. Structural shortage advocates, including major bank economists and CoreLogic, have argued that supply constraints, immigration, and household formation rates justify the prevailing price level.
The comparable evidence from Canada, New Zealand, and Sweden — markets with broadly similar structural features that experienced significant 2022-2023 corrections (15 to 30 percent peak-to-trough in some regions) that Australia largely avoided — suggests that Australian property remains exposed to the same downside risks as other developed-market property bubbles, with the exposure currently masked by continued migration, structural supply shortfalls, and policy settings that effectively underwrite ongoing price appreciation.
Recommended Reading

Key Statistics
Sydney Median House
~AUD $1.4M (2024)
Price-to-Income
13:1 (Sydney)
Household Debt/Income
187%
Bull Run Duration
33+ years
Bank Mortgage Exposure
~60% of big four lending
Warning Signs
- Price-to-income ratios among highest in the world
- Household debt at 187% of income — near global record
- Banking system concentrated in residential mortgages
- Tax policy (negative gearing) actively encouraging speculation
- Dependence on immigration for continued demand
Timeline
1990-91
Last significant national property correction
2003-04
First major boom — Sydney leads
2010-12
Mining boom drives Perth and Brisbane
2015-17
Chinese investment drives Sydney and Melbourne to records
2020
COVID expected to trigger crash — instead reversed by stimulus
2022-23
RBA raises rates aggressively — prices dip 9% then recover
2024
Sydney median reaches ~$1.4M — new all-time high
Lessons Learned
Australia's property market challenges the definition of a bubble. If a bubble is defined solely by deviation from historical norms, Australian property qualifies on every metric. If it requires a crash to prove it was a bubble, then Australia's 33-year run suggests that structural factors (immigration, supply constraints, full recourse lending, central bank intervention) can sustain prices far beyond what traditional analysis would predict. The question is not whether Australian property is overvalued — by most metrics it clearly is — but whether the structural supports are permanent or merely delaying an inevitable correction.
Frequently Asked Questions
What caused the Australian property bubble from 1990 to present?
The Australian property bubble was driven by sustained low interest rates, population growth through immigration, tax incentives like negative gearing, foreign investment (particularly from China), strict land supply restrictions in major cities, and strong economic fundamentals including a mining boom. Government policies favoring property investment over other asset classes created structural demand imbalances.
How much have Australian house prices increased since 1990?
Australian house prices have increased approximately 600-800% since 1990, with median prices in Sydney and Melbourne rising from around $150,000 to over $1 million by 2022. This represents annual average growth of 6-7%, significantly outpacing inflation and wage growth, making it one of the longest continuous property price increases globally.
What are the warning signs of the Australian property bubble?
Warning signs include house price-to-income ratios reaching 8-12 times median household income (well above the 3-4 times considered sustainable), household debt-to-income ratios exceeding 180%, declining rental yields below 3%, and property investment comprising over 60% of new lending. First-home buyer participation has fallen to historic lows.
What lessons does the Australian property bubble teach investors?
The Australian property market demonstrates that bubbles can persist longer than expected when supported by structural factors like population growth and supply constraints. However, it shows the risks of over-leveraging households, policy distortions favoring one asset class, and the danger of assuming 'this time is different' mentality in asset pricing.
Current Relevance
Australian property remains one of the most closely watched markets in the world precisely because it has defied bubble predictions for so long. If Australia can sustain current valuations indefinitely, it would invalidate decades of housing economics research. If it cannot, the correction — given household debt levels — could be among the most severe in developed world history.
Explore gold storage options
Gold is not a guaranteed hedge against crashes. Prices can fall; storage fees and custody risks also matter.
Affiliate link: Bubblepedia may earn a commission. Not a recommendation; investment values can fall.
Recommended Reading
Recent Analysis
Australian Dollar 2026 Rally Erased on RBA Rate Cuts
19 Nov 2026
Construction Productivity Crisis Prices New Housing Out of R
14 Nov 2026
Bank of England Rate Hike Amid Global Equity Rout
6 Nov 2026
Australian Household Debt: The RBA Ratio Explained
23 Oct 2026
Australia's Rental Yield Gap Mirrors Japan's 1991 Bubble
22 Oct 2026
Get Bubblepedia in your inbox
Asset bubbles and market-history insights in your inbox.