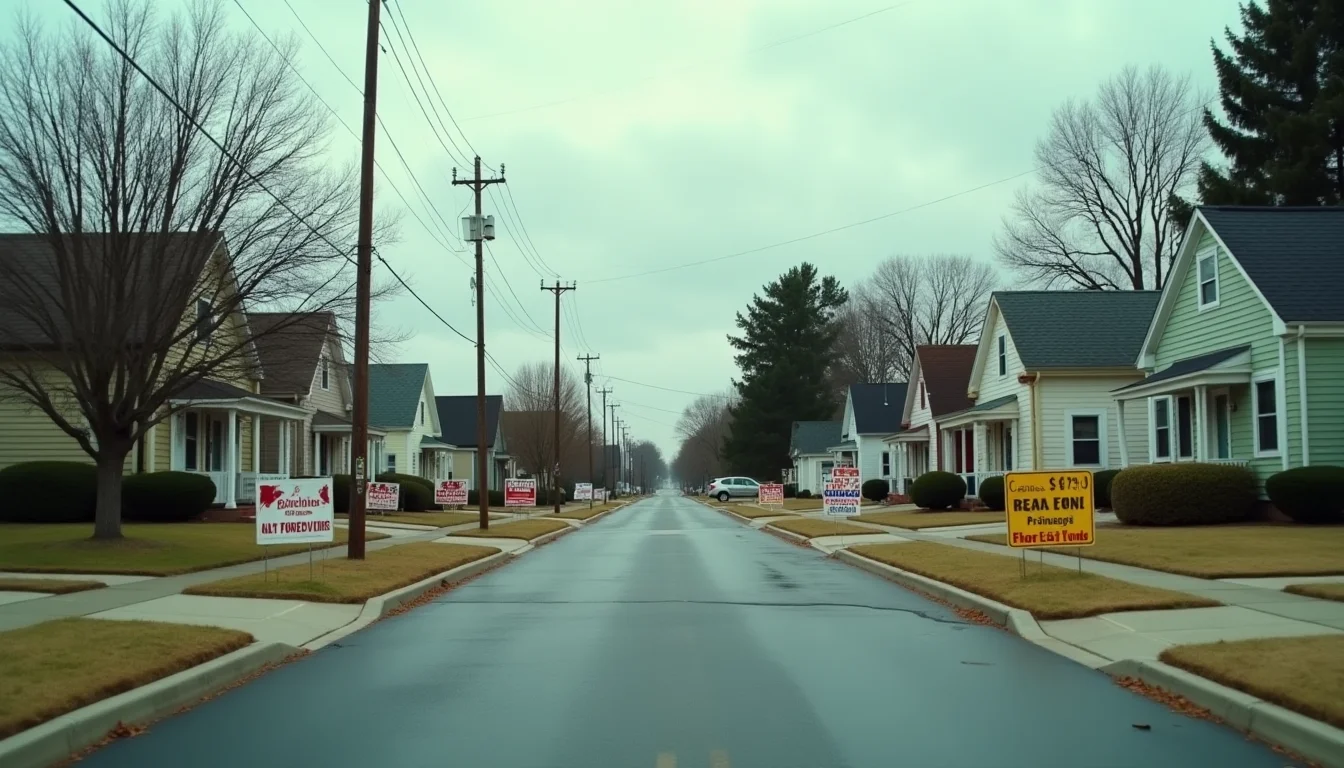
US Housing Bubble and Global Financial Crisis (2003-2008)
Subprime mortgage lending created a property bubble whose collapse nearly destroyed the global financial system. $10 trillion in household wealth was erased.
By Twin · @TwinTowerCity·
Key Takeaways
- →The US housing bubble peaked in 2006 before collapsing and triggering the worst global financial crisis since the Great Depression.
- →Subprime mortgage lending with deteriorated standards was the primary cause, fueled by securitization that separated origination fees from default risk.
- →The bubble's collapse began in 2007 when housing prices started falling and subprime mortgage defaults accelerated rapidly across America.
- →The crisis erased approximately 10 trillion dollars in US household wealth and required massive government bailouts of major financial institutions.
- →The crisis proved that financial innovation can create invisible systemic risks when institutions become too interconnected and large to fail.
Peak Year
2006
Crash Year
2008
Location
United States / Global
Asset Class
Real Estate
Severity
Origins of the Housing Boom
The US housing bubble of the 2000s had roots in multiple converging factors. Following the dot-com crash and September 11 attacks, the Federal Reserve cut the federal funds rate to 1% by June 2003 — the lowest level in 45 years. Simultaneously, government policy actively promoted homeownership: the Community Reinvestment Act was expanded, and government-sponsored enterprises Fannie Mae and Freddie Mac loosened underwriting standards to meet affordable housing goals.
The S&P/Case-Shiller US National Home Price Index rose approximately 124% between January 2000 and its peak in July 2006. In bubble epicentres like Las Vegas, Phoenix, and Miami, prices more than tripled. Homeownership rates rose from 64% in 1994 to a peak of 69.2% in 2004 — the highest in American history.
The Subprime Mortgage Machine
Financial innovation transformed mortgage lending from a relationship-based business into a volume-driven securitisation pipeline. The originate-to-distribute model meant lenders had little incentive to verify borrower quality since loans were quickly packaged into mortgage-backed securities (MBS) and sold to investors worldwide. Subprime mortgage originations rose from $35 billion in 1994 (5% of total originations) to $625 billion in 2005 (20% of the market), according to Inside Mortgage Finance data.
Exotic mortgage products proliferated: adjustable-rate mortgages with low teaser rates, interest-only loans, negative amortisation loans, and stated-income 'liar loans' requiring no income documentation. By 2006, approximately 40% of all mortgages originated were subprime or Alt-A (a category between prime and subprime). Credit rating agencies assigned AAA ratings to senior tranches of MBS pools containing these risky loans, and collateralised debt obligations (CDOs) repackaged lower-rated tranches into supposedly safe securities.
The Unravelling (2006–2008)
Home prices peaked nationally in July 2006 and began declining. As prices fell, borrowers with little or no equity — particularly those with adjustable-rate mortgages facing payment resets — began defaulting in increasing numbers. Subprime mortgage delinquencies rose from 11% in 2006 to over 25% by 2008. The ABX index, which tracked subprime MBS values, began its sustained decline in early 2007.
The crisis escalated through 2007 as major financial institutions revealed massive losses. Bear Stearns' two hedge funds focused on subprime MBS collapsed in June 2007. BNP Paribas froze three investment funds in August 2007, citing inability to value mortgage assets. Northern Rock in the UK experienced the first British bank run in 150 years.
The Financial Crisis
The crisis reached systemic proportions in September 2008. Fannie Mae and Freddie Mac were placed into government conservatorship on 7 September, with combined exposure to $5.3 trillion in mortgage obligations. Lehman Brothers filed for bankruptcy on 15 September — the largest bankruptcy in US history at $639 billion in assets. The next day, the Federal Reserve extended an $85 billion emergency loan to AIG to prevent its collapse, which would have triggered cascading defaults on credit default swaps throughout the global financial system.
The resulting credit freeze threatened the entire global financial system. The Dow Jones fell 54% from its October 2007 peak to its March 2009 trough. Congress passed the $700 billion Troubled Asset Relief Program (TARP) in October 2008. The Federal Reserve cut interest rates to effectively zero and initiated quantitative easing, eventually purchasing over $1.7 trillion in mortgage-backed securities.
Aftermath and Human Cost
The aftermath was devastating. Approximately 3.8 million foreclosure filings occurred in 2010 alone, according to RealtyTrac. US household wealth declined by approximately $13 trillion between 2007 and 2009. Unemployment peaked at 10% in October 2009, and remained above 8% until September 2012. The median US household saw its net worth fall 39% between 2007 and 2010, according to the Federal Reserve's Survey of Consumer Finances.
The crisis produced the Dodd-Frank Wall Street Reform and Consumer Protection Act of 2010, the most comprehensive financial regulatory overhaul since the 1930s. It created the Consumer Financial Protection Bureau, imposed stress testing requirements on major banks, and established the Volcker Rule restricting proprietary trading. The 2008 crisis remains the defining financial event of the 21st century and a stark demonstration of how financial innovation, regulatory failure, and misaligned incentives can produce systemic catastrophe.
The Securitisation Chain — From Ohio to Norway
The defining structural feature of the 2008 crisis was not the underlying mortgage origination — bad loans had been made in every previous property cycle — but the chain of financial engineering that converted those loans into securities held in portfolios that had no operational understanding of what they owned. The chain operated as follows.
A loan officer at a brokerage in Cleveland or Phoenix would originate a mortgage, frequently to a borrower with no documented income, no down payment, and a credit score below 620. The loan was sold within days to a Wall Street investment bank — Lehman Brothers, Bear Stearns, Merrill Lynch, Citigroup, or Morgan Stanley were the largest buyers — at a small premium to face value. The investment bank pooled thousands of such loans into a residential mortgage-backed security (RMBS), which it then sold in tranches: the lowest-risk "senior" tranches typically rated AAA, the middle "mezzanine" tranches rated A or BBB, and a small "equity" tranche absorbing first losses.
The mezzanine tranches — frequently rated BBB — were difficult to sell on their own. The solution was the collateralised debt obligation (CDO): pool dozens of BBB tranches from many different RMBS deals, then re-tranche the result. Through the alchemy of structured finance, roughly 80% of the resulting CDO was rated AAA — backed by the same BBB underlying that the rating agencies had said was barely investment grade. The remaining 20% was sometimes pooled again into a CDO-squared, producing AAA tranches backed by AAA tranches of CDOs backed by BBB tranches of RMBS backed by mortgages to borrowers with no documented income.
By 2007, approximately $700 billion of subprime-backed CDOs had been issued, with AAA tranches placed in pension funds, insurance companies, sovereign wealth funds, and public-sector financial institutions on every continent. The Norwegian municipal pension fund of Narvik (population 18 000) lost approximately $64 million on US subprime CDOs purchased through Citigroup. German Landesbanken — regional public-sector banks — collectively wrote down more than €40 billion. The Korean and Taiwanese central bank reserve managers, the Australian super funds, and the Italian regional treasuries all held material positions. The chain functioned because every participant trusted the AAA rating and the participant immediately upstream.
The Rating Agency Failure
The conflict of interest at the heart of the rating-agency model is straightforward and was understood by participants long before 2008. The issuer of a security pays the rating agency directly for the rating; the rating is sought before the security is issued; if one agency declines to assign the desired rating, the issuer can shop to another. Moody's, S&P, and Fitch competed for issuer business, and the rapid growth of structured finance in the 2003–2007 period meant that issuer fees became the dominant revenue stream for all three agencies. By 2006, structured-finance ratings provided roughly 44% of Moody's revenue.
The Senate Permanent Subcommittee on Investigations report of 2011 documented the consequences. Internal Moody's emails described entire departments as "running scared" of losing business if ratings were tightened. Analysts who proposed more conservative methodologies were transferred or terminated. The agencies' models for subprime RMBS used historical loss data from a period of rising house prices and assumed that geographic diversification would prevent simultaneous regional declines — an assumption that ignored the fact that the entire national subprime origination process was the new common factor across regions.
Between July 2007 and December 2008, Moody's downgraded 73% of all AAA-rated subprime RMBS tranches it had issued in 2006. Fitch and S&P performed similarly. The cumulative wealth destruction from this single ratings failure has been estimated at $2 trillion across global investors. No criminal charges were brought against any rating agency executive; the agencies paid civil settlements totalling approximately $1.9 billion (Moody's $864 million in 2017; S&P $1.5 billion in 2015) without admitting wrongdoing.
The Lehman Weekend
The 72 hours between Friday 12 September and Monday 15 September 2008 are the most analysed weekend in financial history. By Friday morning, Lehman Brothers had lost more than 90% of its market capitalisation since the start of the year and was unable to roll its short-term funding in the repo market. Treasury Secretary Henry Paulson, Federal Reserve Chairman Ben Bernanke, and New York Fed President Timothy Geithner convened the heads of the major Wall Street firms at the New York Federal Reserve to organise either a private-sector rescue or an orderly buyer.
Two potential acquirers had been identified: Bank of America and Barclays. Bank of America withdrew on Saturday morning, redirecting its attention to acquiring Merrill Lynch (which closed on Sunday at $50 billion). Barclays' purchase of Lehman was conditional on a UK government guarantee that Chancellor Alistair Darling refused to provide, citing the unwillingness to import US risk onto the UK balance sheet. By Sunday evening, no buyer remained and no public-sector backstop was extended. Lehman filed Chapter 11 at 1:45 a.m. on Monday 15 September 2008, the largest bankruptcy in US history with $619 billion in liabilities.
The decision not to rescue Lehman has been defended by Paulson on the grounds that there was "no legal authority" to inject capital into a solvent bank without legislation; critics have pointed out that the same authority gap existed when Bear Stearns was rescued through JPMorgan in March 2008 and when AIG was effectively nationalised the day after Lehman failed. The honest reading is probably that the political appetite for a third Wall Street rescue had been exhausted and that the Treasury believed — wrongly — that markets had had six months to prepare for Lehman's failure.
What happened next was the rolling collapse of confidence in the global wholesale funding system. The Reserve Primary Fund, a money market fund holding Lehman commercial paper, "broke the buck" on Tuesday 16 September. Money market redemptions spiked. Inter-bank lending froze. Three-month LIBOR-OIS spreads, the standard measure of bank funding stress, blew out from 76 basis points on Friday to 365 basis points by 10 October. The crisis that had begun as a US subprime problem became, in those weeks, a global liquidity event affecting every major financial institution.
TARP, the Tea Party, and Occupy Wall Street
The Troubled Asset Relief Program, signed into law on 3 October 2008, authorised $700 billion of Treasury purchases of distressed mortgage assets. In practice, the funds were used differently from their authorisation: $250 billion was used to inject capital directly into the nine largest US banks (the Capital Purchase Program), $80 billion to support the auto industry, $70 billion to recapitalise AIG, and the remainder allocated across smaller programmes. The eventual realised cost to taxpayers was substantially below the headline figure — roughly $30 billion in net losses on TARP itself, with the bank recapitalisation programme actually generating a modest profit.
"The bailout worked, in the narrow technical sense that the financial system did not collapse. It did not work, in the broader political sense, because it created the perception that the costs of speculation were socialised while the gains had been privatised. That perception was correct. Its political consequences are still working through American democracy."
The Tea Party movement, which emerged in February 2009 in direct response to TARP and the Obama administration's housing policies, captured 63 House seats in the 2010 midterm elections — the largest swing in American politics since 1948. Occupy Wall Street, which began in Zuccotti Park in September 2011, coined the "We are the 99%" framing that has shaped progressive political discourse since. Both movements are direct downstream consequences of the perception, accurate in essential details, that the response to the 2008 crisis prioritised the stability of the financial system over the welfare of the borrowers and homeowners caught in its collapse.
Approximately 9.3 million American households lost their homes to foreclosure between 2006 and 2014 according to RealtyTrac data. Net household wealth in the bottom 50% of the US wealth distribution did not recover to pre-crisis levels until 2018 — a full decade later. See Spain and Ireland for the parallel European experiences of the same global credit cycle.
Recommended Reading
Key Statistics
Home Price Increase
124% (1997-2006)
Lehman Bankruptcy
$639 billion
Household Wealth Lost
$10 trillion
Dow Decline
54% peak to trough
Peak Unemployment
10%
Bailout Cost (TARP)
$700 billion authorised
Warning Signs
- NINJA loans — lending to borrowers with no income, no job, no assets
- Home prices rising far faster than incomes for a decade
- Rating agencies giving AAA to subprime-backed securities
- Property flipping shows on television celebrating speculation
- Home ownership at all-time highs driven by loose lending, not income growth
Timeline
2001-03
Fed cuts rates to 1% — cheap mortgages flood the market
2003-06
Home prices accelerate — subprime lending explodes
Jul 2006
US median home prices peak — Case-Shiller at all-time high
2007
Adjustable rate mortgages reset — defaults surge
Mar 2008
Bear Stearns collapses — acquired by JP Morgan
15 Sep 2008
Lehman Brothers files for bankruptcy — global panic
Oct 2008
Congress passes $700 billion TARP bailout
Mar 2009
Markets bottom — Dow at 6,547 (from 14,164)
Lessons Learned
The 2008 crisis demonstrated that financial innovation can create systemic risks invisible to regulators, rating agencies, and even the institutions creating them. When the fees for originating and securitizing mortgages are separated from the risk of default, lending standards will inevitably collapse. The crisis proved that 'too big to fail' is not a policy but a reality — when institutions become so interconnected that their failure threatens the entire system, governments have no choice but to intervene, socializing the losses while privatizing the gains.
Frequently Asked Questions
What caused the 2008 housing bubble?
The bubble was caused by loose lending standards, subprime mortgages given to unqualified borrowers, financial deregulation, and securitization of risky mortgages. Banks packaged bad loans into complex securities sold worldwide. Government policies encouraging homeownership, low interest rates, and speculation in real estate markets amplified the problem significantly.
How much did housing prices fall during the 2008 crisis?
US housing prices fell approximately 30% nationally from peak to trough between 2006-2012. Some markets like Las Vegas, Phoenix, and Miami experienced drops exceeding 50%. The Case-Shiller Home Price Index declined 33% nationally, while $10 trillion in household wealth was erased during the crisis period.
What were the warning signs of the 2008 housing bubble?
Warning signs included rapidly rising home prices exceeding income growth, NINJA loans (no income, no job, no assets verification), increasing mortgage debt-to-income ratios, speculative buying, and exotic mortgage products like interest-only loans. Housing inventory began building up, and mortgage delinquencies started rising before the crash.
What lessons does the 2008 housing crisis teach investors?
Key lessons include: asset prices can disconnect from fundamentals, leverage amplifies both gains and losses, diversification across asset classes is crucial, and regulatory oversight matters. Investors should be wary of 'this time is different' mentality, understand what they're investing in, and maintain emergency funds for economic downturns.
Current Relevance
With property markets in multiple countries at or above 2006-equivalent valuations, household debt at record levels, and central banks having spent 15 years inflating asset prices through zero interest rates and quantitative easing, the fundamental dynamics that caused 2008 are arguably more dangerous at the global level today.
Explore gold storage options
Gold is not a guaranteed hedge against crashes. Prices can fall; storage fees and custody risks also matter.
Affiliate link: Bubblepedia may earn a commission. Not a recommendation; investment values can fall.
Recommended Reading
Recent Analysis
Anthropic Leveraged ETF Race Heats Up: When Volatility Becomes a Retail Product
20 Nov 2026
Construction Productivity Crisis Prices New Housing Out of R
14 Nov 2026
Bank of England Rate Hike Amid Global Equity Rout
6 Nov 2026
BMW Cuts Profits While Accelerating Investment
5 Nov 2026
RBA Rate Call: Key Data That Could Signal Bubble Risk
21 Oct 2026
Get Bubblepedia in your inbox
Asset bubbles and market-history insights in your inbox.