Irish Property Bubble and Celtic Tiger Collapse (1995-2008)
Ireland's Celtic Tiger property boom ended with a banking collapse that cost an estimated €45–64 billion and left ghost estates across the countryside.
By Twin · @TwinTowerCity·
Key Takeaways
- →Ireland's property prices peaked in 2007 after a thirteen-year boom from 1995 that created the Celtic Tiger economy.
- →Light-touch banking regulation and tax policies favoring property speculation enabled the shift from productive investment to speculative development.
- →The 2008 global financial crisis triggered Ireland's property collapse, exposing unsustainable debt levels in the banking sector.
- →Ireland's banking collapse cost taxpayers an estimated €45–64 billion through bailouts and left ghost estates across the countryside.
- →Ireland's overnight blanket bank guarantee in 2008 demonstrates the catastrophic fiscal cost of socializing private banking losses.
Peak Year
2007
Crash Year
2008
Location
Ireland
Asset Class
Real Estate
Severity
What Caused the Irish Property Bubble and Celtic Tiger Collapse?
Ireland's property bubble was one of the most extreme in modern European history, transforming the country from one of Europe's poorest members to one of its wealthiest — and then back again — within two decades. The roots lay in Ireland's accession to the European Monetary System and later the eurozone, which brought interest rates down from double digits in the early 1990s to below 4% by the early 2000s. The Celtic Tiger economic boom of the 1990s was initially driven by genuine productivity growth: foreign direct investment from US technology and pharmaceutical companies, a well-educated English-speaking workforce, and low corporate tax rates (12.5%) created a virtuous cycle of employment growth, rising incomes, and increasing demand for housing.
The Mania Phase
What began as a housing market supported by genuine economic fundamentals mutated into a pure speculative bubble after approximately 2002. House prices nationally more than tripled between 1996 and 2007, with Dublin prices rising even faster. At the peak, Ireland was building approximately 90,000 new housing units per year — for a country of 4.4 million people, this was roughly twice the rate of the United States on a per-capita basis. Construction and related sectors grew to represent approximately 25% of GDP and tax revenue. Bank lending to property developers and homebuyers expanded at rates exceeding 25% annually, funded increasingly by wholesale borrowing from international money markets rather than domestic deposits. Anglo Irish Bank, which became the most aggressive property lender, grew its loan book from €11 billion in 2003 to over €72 billion by 2007.
Peak Conditions
By 2007, the average house price in Dublin had reached approximately €420,000 — roughly 12 times the average industrial wage. Total private sector credit had grown to approximately 200% of GDP. The Irish banking system's total assets were approximately 5 times GDP, making it one of the most leveraged banking systems in the developed world relative to the size of its economy. Tax revenue had become dangerously dependent on property transactions: stamp duty, capital gains tax, and VAT on construction collectively provided approximately 18% of total government revenue. Despite these warning signs, official commentary remained overwhelmingly positive — the Central Bank of Ireland and the Financial Regulator consistently downplayed bubble risks.
How Did the Irish Property Bubble and Celtic Tiger Collapse Crash?
The crash, when it came, was swift and devastating. House prices fell approximately 54% nationally from peak to trough, with some areas experiencing declines of 70% or more. Anglo Irish Bank's collapse was the most dramatic: the bank was nationalised in January 2009 after it was revealed that its chairman had taken undisclosed loans of €87 million from the bank. The total cost of the Irish bank bailout reached approximately €64 billion — roughly €14,000 for every person in the country. In November 2010, Ireland was forced to accept a €67.5 billion bailout from the EU and IMF as the cost of the bank rescue threatened to overwhelm the sovereign. Unemployment rose from 4.5% in 2007 to over 15% by 2012.
Aftermath and Recovery
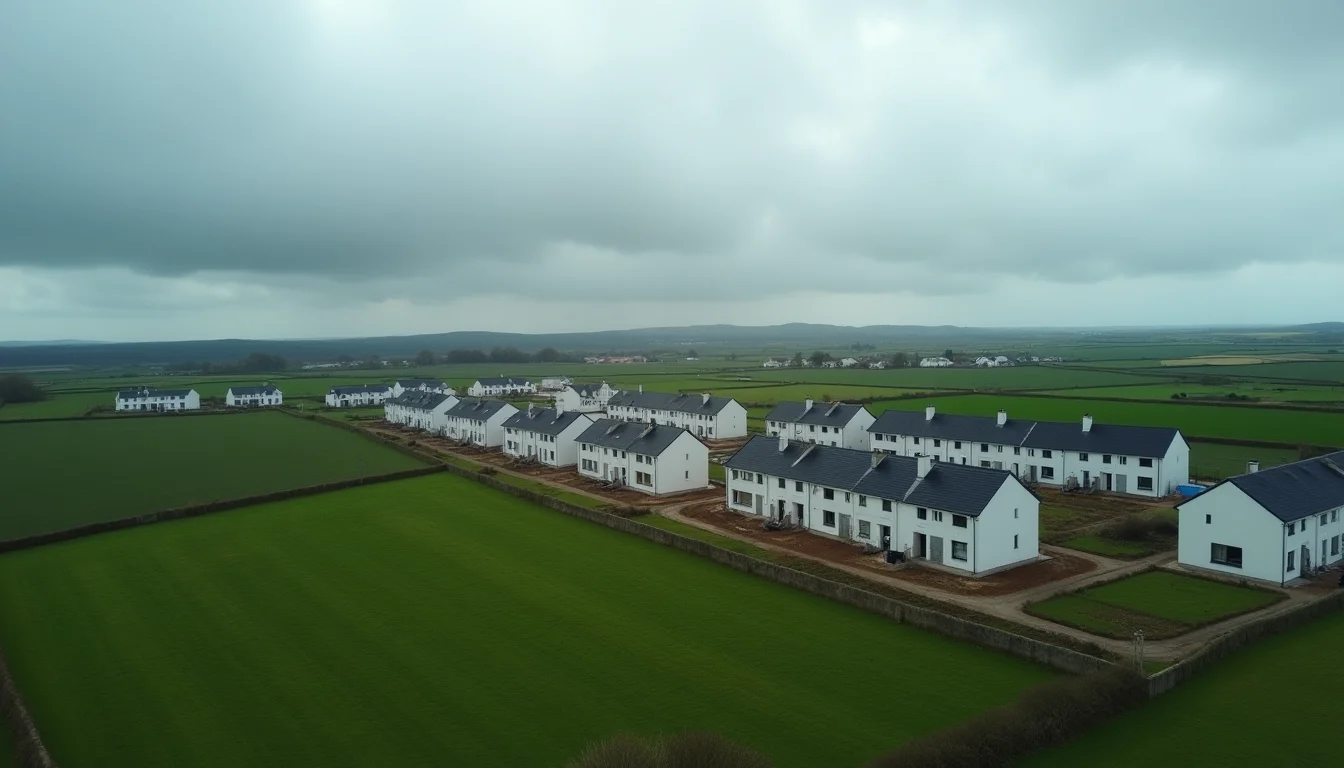
The bailout imposed severe austerity on Ireland: tax increases, public sector pay cuts of up to 20%, and deep cuts to social services. Emigration surged, with an estimated 400,000 people leaving the country between 2008 and 2015 — echoing the mass departures of previous economic crises. The National Asset Management Agency (NAMA) was created to absorb approximately €74 billion (face value) of toxic property loans from the banks, purchasing them at a discount of approximately 57%. 'Ghost estates' — partially completed housing developments abandoned by bankrupt developers — dotted the Irish landscape, with over 2,800 identified by 2010. Many homeowners found themselves in severe negative equity, with mortgages far exceeding the value of their homes.
Lasting Legacy
Ireland's experience became one of the defining case studies of the eurozone crisis. It demonstrated how a small, open economy within a monetary union could experience a devastating boom-bust cycle without access to independent monetary policy tools. The 'socialisation of private banking losses' — the decision to guarantee bank debts and transfer the cost to taxpayers — became enormously controversial and shaped Irish politics for a generation. The crisis also exposed the failure of 'light-touch' financial regulation that had been a deliberate policy choice to attract international financial services. Ireland's subsequent recovery — which saw it return to strong GDP growth by 2014 — was real but uneven, with the benefits flowing disproportionately to the multinational corporate sector while many ordinary Irish people continued to deal with the legacy of mortgage debt and diminished public services.
The Celtic Tiger Foundation
Ireland in 1990 was, by the measures that mattered, a poor European country. GDP per capita stood at roughly 70% of the EU average. Unemployment was 13.4%. Net emigration averaged 30 000 per year throughout the 1980s, predominantly young, educated workers leaving for the United Kingdom, the United States, and Australia. Government debt-to-GDP exceeded 100%. The country's principal export industries — agriculture, textiles, and pharmaceuticals — were either declining or competing on price terms unfavourable to a high-cost Atlantic economy.
The transformation that produced the Celtic Tiger had three institutional foundations and one demographic accident. The institutional foundations were European Union membership (formally the European Economic Community from 1973, deepened by the Single European Act of 1986 and Maastricht in 1992); the deliberate cultivation of a 12.5% corporate tax rate that made Ireland the most attractive EU jurisdiction for US multinational headquarters and intellectual property; and English as the working language, which allowed seamless integration with the dominant US technology and pharmaceutical sectors. The demographic accident was a baby boom that had peaked in the late 1970s and that delivered an unusually large cohort of young, educated, English-speaking workers into the labour market exactly as the Single Market took effect.
The combination produced GDP growth averaging 9.4% annually between 1995 and 2000 — rates more typical of an East Asian developmental state than of a European country. Unemployment fell from 13.4% in 1993 to 3.7% by 2000. Net emigration reversed: by 2002, Ireland was a net immigration destination for the first time in its history, attracting workers from the new EU accession states and returning Irish emigrants. This was the genuine displacement underlying the subsequent property bubble. The mistake came in extrapolating productivity-driven growth into the 2002–2007 period, when the actual driver of the economy quietly shifted from exports to construction.
Anglo Irish Bank and Sean FitzPatrick's Hidden Loans
The institutional epicentre of the Irish bubble was Anglo Irish Bank. Founded in 1964 as a small commercial lender, Anglo Irish was transformed under the leadership of Sean FitzPatrick (CEO 1986–2005, then chairman) into the most aggressive property-development lender in Europe. By 2007, Anglo Irish's loan book had grown to €72 billion — more than 30 times its 1995 size — with approximately 80% concentrated in commercial property and property-development lending. Roughly half of that exposure was to a small group of perhaps fifteen developers, of whom the most prominent — Sean Dunne, Liam Carroll, Bernard McNamara, the Quinn family — would become the iconic ruined figures of the post-crisis period.
The bank's governance was as concentrated as its lending. FitzPatrick had been moving large personal loans — totalling €87 million at peak — between Anglo Irish and Irish Nationwide Building Society at every year-end for eight consecutive years, a practice that hid the loans from disclosure in either institution's audited accounts. The arrangement was discovered in December 2008 and prompted FitzPatrick's resignation; he was eventually tried and acquitted in 2017 on charges of misleading auditors, after one of the longest criminal trials in Irish legal history.
The decisive moment for Anglo Irish — and for Irish sovereign credit — came on the night of 29–30 September 2008. With the bank facing imminent funding collapse following Lehman, the government of Brian Cowen issued a blanket guarantee covering all deposits and all senior bondholders of the six major Irish banks, totalling approximately €440 billion of liabilities — more than twice Irish GDP. The guarantee was extended in the belief that the underlying banks were solvent and merely facing a liquidity squeeze. They were not. Anglo Irish ultimately required €30 billion of state recapitalisation and was nationalised in January 2009.
The €85 Billion Bailout and Austerity
The cumulative cost of recapitalising the Irish banking system reached approximately €64 billion by end-2010, equivalent to roughly 40% of Irish GDP. The fiscal deficit ballooned to 32.4% of GDP in 2010 — a peacetime record for any developed economy and almost entirely attributable to one-off banking costs. Sovereign bond yields, which had traded inside German Bunds at the bubble peak, blew out to 9.1% by November 2010. Ireland was effectively locked out of bond markets.
On 28 November 2010, the Irish government formally requested assistance from the European Union and the International Monetary Fund. The eventual programme, agreed in December, drew €67.5 billion of external loans (€22.5 billion each from the IMF, the European Financial Stability Facility, and the European Financial Stability Mechanism) supplemented by €17.5 billion of Irish state contributions, for a total programme of €85 billion. The terms were demanding: an immediate fiscal consolidation of €15 billion over four years, the establishment of NAMA (the National Asset Management Agency) to absorb commercial property loans at deep discounts, and structural reforms to the banking sector.
The austerity programme that followed was the deepest in any post-bailout Eurozone country. Public sector wages were cut by an average of 14% across two budgets. The Universal Social Charge was introduced and broadened. Capital spending was reduced by more than 60% from peak. Public sector employment fell by approximately 10% through a combination of recruitment freeze, voluntary redundancy, and reduced hours. The political cost was severe: the Fianna Fáil party, which had governed Ireland for most of the previous eighty years and had presided over the bubble, was reduced from 78 to 20 seats in the February 2011 general election, the worst result in its history.
The Recovery and the Lessons
Ireland's exit from the bailout programme in December 2013 — without a precautionary credit line, the only Eurozone bailout country to do so — and its subsequent economic performance constitute one of the most striking institutional recoveries in recent European history. Real GDP growth resumed in 2014 and accelerated to 8.7% in 2015, the highest in the EU. Unemployment fell from a peak of 16% in 2012 to 4.6% by 2019. Sovereign yields converged inside Bunds by 2017. The country regained its pre-crisis investment-grade credit ratings within a decade.
"The honest lesson of Ireland is uncomfortable for both sides of the bailout debate. Austerity worked — the Irish recovery is real. And austerity was unnecessary in scale, because the underlying problem was a banking guarantee that should never have been extended. Both statements are true, and the Irish experience is the cleanest test in the post-2008 record of how much of the cost of a bailout is the bailout itself."
The structural lesson, contested but increasingly accepted, concerns the choice between a blanket bank guarantee and a bail-in regime that imposes losses on senior bondholders. The Cypriot bail-in of March 2013 — which imposed losses on uninsured depositors at Bank of Cyprus and Laiki Bank — was made possible institutionally because the Irish guarantee had demonstrated the unsustainable cost of the alternative. The EU Bank Recovery and Resolution Directive of 2014, which established the bail-in framework now standard across the Eurozone, was drafted explicitly with the Irish guarantee as the cautionary case.
The deeper lesson is about institutional resilience. Ireland recovered because it possessed a flexible labour market, a deep stock of human capital from the Celtic Tiger years, an export sector anchored by US multinationals that continued investing through the crisis, and a political culture that absorbed the costs of adjustment without populist fragmentation. Countries facing similar crises without those preconditions — most obviously Greece — experienced fundamentally different recoveries. See Spain for the contemporaneous Mediterranean parallel, and the Nordic banking crisis for the closest historical precedent of a small open economy recovering from a property-driven banking collapse.
Recommended Reading
Key Statistics
House Price Increase
3x (1996-2007)
Construction % of GDP
23% at peak
Bank Guarantee
~€440 billion (2x GDP)
Bailout Cost (est.)
€45–64 billion (depending on measure)
EU/IMF Bailout
€85 billion
Warning Signs
- Construction at 23% of GDP — triple the healthy norm
- House prices tripling in a decade
- One bank growing exponentially through aggressive property lending
- Tax incentives actively encouraging property speculation
Timeline
1996
Celtic Tiger economy begins — genuine growth
2002
Growth shifts from FDI to property speculation
2007
Property prices peak — 300% above 1996 levels
Sep 2008
Government guarantees all bank liabilities — ~€440 billion
2010
EU/IMF bailout — €85 billion
2013
Property prices bottom — 55% below peak
Lessons Learned
Ireland demonstrates how a genuine economic success story can be hollowed out by a property bubble. The shift from productive investment to speculative property development was enabled by light-touch regulation and tax policy that rewarded speculation. The blanket bank guarantee — made in a panic-driven overnight decision — demonstrates the catastrophic cost of socializing private bank losses. Ireland's recovery, while impressive, came at an enormous social cost.
Frequently Asked Questions
What caused the Irish property bubble during the Celtic Tiger period?
The Irish property bubble was caused by rapid economic growth, low EU interest rates, deregulated banking, massive capital inflows, and government tax incentives for property development. Banks engaged in reckless lending with loan-to-value ratios exceeding 100%. EU membership and corporate tax advantages attracted foreign investment, fueling excessive speculation in residential and commercial real estate from 1995-2008.
How much did Irish property prices rise and fall during the Celtic Tiger bubble?
Irish property prices increased by approximately 500% between 1995-2007, with Dublin prices rising even more dramatically. After the bubble burst, property values fell by 50-60% nationally from peak to trough by 2012. Commercial property prices declined by up to 67%, making it one of the most severe property crashes in developed world history.
What were the warning signs of the Irish property bubble collapse?
Warning signs included house prices rising far beyond wage growth, construction representing 25% of GDP by 2006, massive current account deficits, bank lending growing at 30% annually, and ghost estates appearing nationwide. International economists warned of unsustainable debt levels, while construction employment reached historically unprecedented levels relative to population size.
What lessons does the Irish Celtic Tiger property bubble teach investors?
The Irish bubble demonstrates that rapid economic growth can mask unsustainable asset price inflation, regulatory capture leads to systemic risk, and government fiscal policy shouldn't amplify property cycles. It shows the dangers of bank concentration in property lending, the importance of counter-cyclical policies, and how external capital flows can destabilize small economies.
Current Relevance
Ireland's experience is a warning to any small open economy experiencing rapid property price growth with concentrated banking sector exposure. The pattern of genuine economic growth being replaced by property-dependent growth is visible in multiple markets today.
Explore gold storage options
Gold is not a guaranteed hedge against crashes. Prices can fall; storage fees and custody risks also matter.
Affiliate link: Bubblepedia may earn a commission. Not a recommendation; investment values can fall.
Recommended Reading
Recent Analysis
Australian Household Debt: The RBA Ratio Explained
23 Oct 2026
Ireland's Celtic Tiger Collapse: A Housing Bubble Case Study
15 Oct 2026
Australia's Construction Boom: Echoes of Celtic Tiger
14 Oct 2026
Credit Crunch & Property Crashes: Historical Patterns
21 Sept 2026
Australia's Migration-Driven Property Bubble Risk
20 Sept 2026
Get Bubblepedia in your inbox
Asset bubbles and market-history insights in your inbox.