Market Bubble Analysis & Commentary
Daily commentary on the speculative excesses, valuation extremes, and structural risks shaping global markets right now. Articles cover equities, property, crypto, commodities, and the macro forces that drive boom-and-bust cycles, with frequent reference to historical parallels documented in the encyclopedia. Each piece is written to translate complex market signals into clear, actionable context for long-term investors.
Analysis falls into four recurring categories — historical-parallel pieces that map a current market condition onto a documented past bubble; crypto-market-cycle notes that track halving positioning, stablecoin reserves, and exchange-concentration risk; property-market-risk pieces that examine credit availability, household debt, and rental-yield gaps; and global-market-risk articles that focus on yield-curve signals, central-bank divergence, and sovereign-debt sustainability. The category badge on each card identifies which lens the article uses.
Every article is written to a strict editorial standard. Specific numbers must be traceable to live indicator data or supplied source text. Speculative phrasing is avoided. Articles below an 800-word threshold are rejected and regenerated. Pieces flagged for review are held back rather than published with disclaimers. Use this feed to track how today's risks are evolving and where the next mania may already be forming.
The pipeline that produces these articles draws on a structured set of inputs: a daily-refreshed table of macro indicators (Shiller CAPE, Buffett Indicator, US 10-year yield, MOVE index, Bitcoin dominance, stablecoin reserves, household debt-to-GDP, and roughly forty others), a curated news feed scraped from central-bank statements, regulatory filings, and major financial outlets, and the full encyclopedia of historical bubbles for parallel-matching. The model is instructed to flag any indicator reading that crosses a documented historical threshold and to anchor its analysis in that signal rather than in sentiment or narrative.
Editorial independence matters. Bubblepedia does not accept sponsored placements inside analysis articles, and affiliate links — where they appear — are confined to clearly labelled blocks separated from the body copy. We do not short or hold leveraged positions in any asset discussed, and we do not publish price targets or trade recommendations. The goal is structural understanding: helping readers recognise the shape of a bubble before it bursts, and the shape of a recovery before it begins. Bookmark this page or subscribe to the weekly digest to follow the analysis as it evolves.

Iran War Premium, Jobs Blowout, and Concentrated Equities: How Geopolitical Supply Shocks Expose Fragile Markets
As hedge funds drive bullish oil bets to multi-month highs on Iran conflict fears and Wall Street's risk complex shrugs off rate threats after a blowout jobs report, the collision of geopolitical supply shock and extreme equity concentration is creating a historically familiar —

Hash Ribbons Are Compressing Again — and 2013's Miner Exodus Explains Why That Matters
Bitcoin's Hash Ribbon indicator is flashing miner capitulation signals in September 2026, a pattern that historically precedes either a sustained recovery or a deeper price dislocation — and the 2013 bubble cycle offers the most instructive precedent.

Construction Sector Concentration and Economic Vulnerability: Lessons from Ireland and Spain's Property Collapses
When residential construction swells to an outsized share of GDP, history shows that the subsequent correction punishes not just developers but entire national economies — a pattern visible in Ireland 2007, Spain 2008, and increasingly relevant to Australia in 2026.

ECB Expected to Deliver One Final Rate Hike Next Week, Economists Say
As the ECB prepares what economists expect to be its final rate increase of the cycle, the compounding cost of sovereign debt across the eurozone raises structural questions that equity valuations and bond spreads have not yet fully priced.

Stablecoin Crisis: How Tether's 2026 Reserves Hide Systemic Risk
As stablecoin supply hits new highs in 2026, the opacity and concentration risk embedded in Tether's reserve structure echoes the trust-dependent, disclosure-light dynamics that collapsed NFT valuations in 2022 — and poses a systemic threat the current bull market has not priced
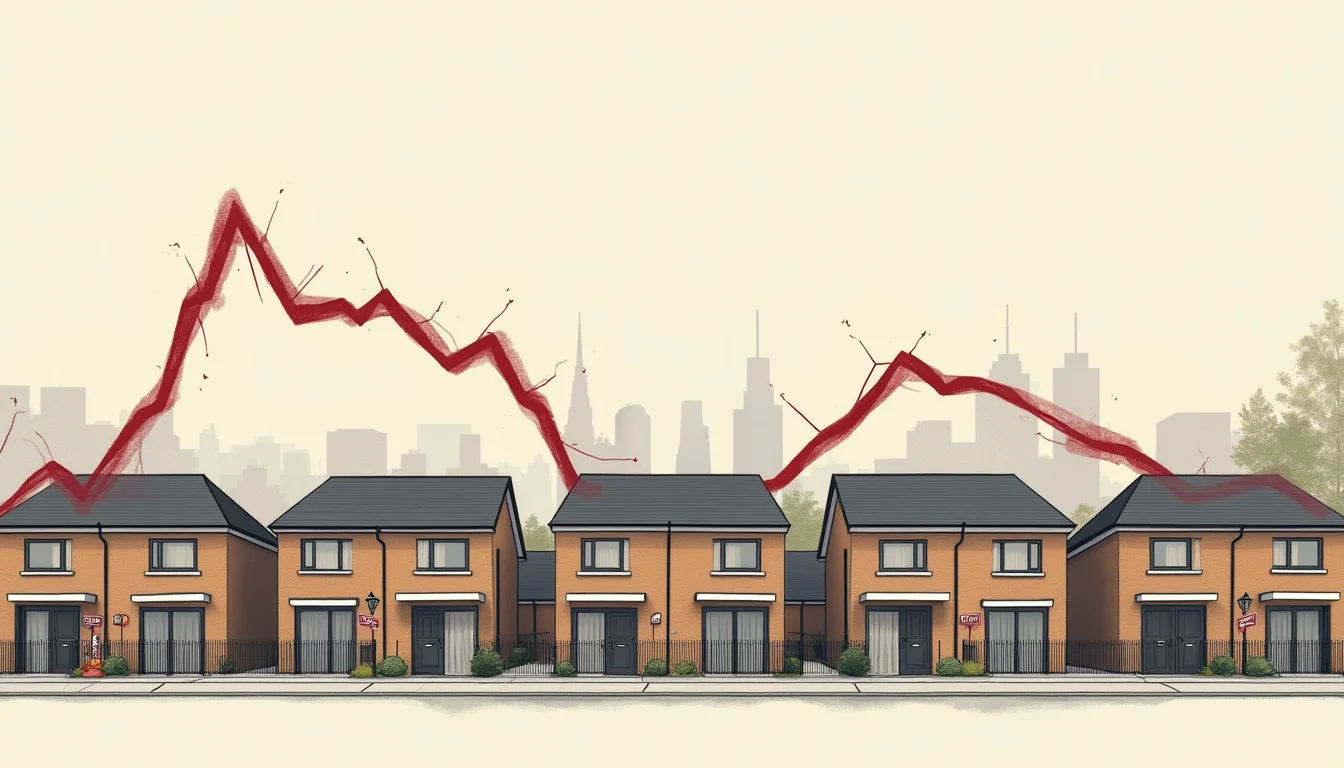
Crest Nicholson's Profit Warning and the Debt-to-Income Reckoning Arriving Across Anglophone Property Markets
UK housebuilder Crest Nicholson's full-year loss warning signals that elevated household debt-to-income ratios — not just interest rates — are now the structural brake on Anglophone property markets, echoing the early unravelling of Ireland's and Spain's construction sectors in 2

Gross Rental Yields vs. Bond Yields: How the Spread Between Them Has Historically Signalled Property Market Corrections
When the gap between gross residential rental yields and risk-free government bond yields compresses to zero or inverts, history shows that property markets face severe correction risk — and that gap is once again flashing warning signals in Australia and other advanced economies

China-US Yield Gap Nears Record as Central Bank Divergence Rewrites Global Capital Flows
As the gap between Chinese and US sovereign yields approaches historic extremes and a fresh Treasury selloff deepens, the structural divergence between the world's two largest central banks is redirecting capital in ways that echo the monetary mismanagement at the heart of histor

1970s Inflation Cycle Returns: September 2026 Reassembly
With sovereign bond yields hitting their highest levels since 2008 and Strait of Hormuz attacks threatening oil supply, the structural combination of monetary instability, geopolitical supply shock, and commodity-driven inflation that defined the 1970s supercycle is reappearing w

London Stock Exchange Plans Tokenized Stocks in Partnership with Kraken Parent Payward
The London Stock Exchange's move into tokenized equities is landing at a moment when Bitcoin's fourth halving cycle is searching for a narrative catalyst — a pattern that rhymes uncomfortably with the infrastructure legitimacy plays that preceded every major crypto blow-off top.

Lenders Tighten Before Prices Fall: The Credit Availability Turn That Precedes Every Property Bust
Across every major property bust of the past four decades, the withdrawal of credit availability preceded price declines by months or years — and the structural mechanics of that turn are more predictable than most investors acknowledge.

Global Bond Yields Hit Highest Since 2008, Echoing 1994 and 1999-2000
As global sovereign yields climb to their highest levels since 2008 and Australia's benchmark bond hits a 15-year peak, the term-premium signal that preceded every major post-war equity correction is flashing again — with AI infrastructure spending adding a dangerous new dimensio

Investors Grow Wary After Fed Chair Warsh Speech Fuels Rate-Hike Bets, Rattling Equity Markets
Federal Reserve Governor Kevin Warsh's hawkish remarks have revived rate-hike speculation at a moment when AI valuations are stretched in ways that rhyme unmistakably with 1999 — and the mechanism that ultimately broke the dot-com bubble was not a collapse in faith in the interne

Strategy's $370M Bitcoin Buy: Supply Scarcity Without Demand
Michael Saylor's Strategy has restarted its Bitcoin accumulation at the precise moment a US-Iran military exchange is spiking oil prices and rattling equities, forcing a reassessment of whether the fourth halving cycle's expected bull phase is on schedule or structurally delayed.
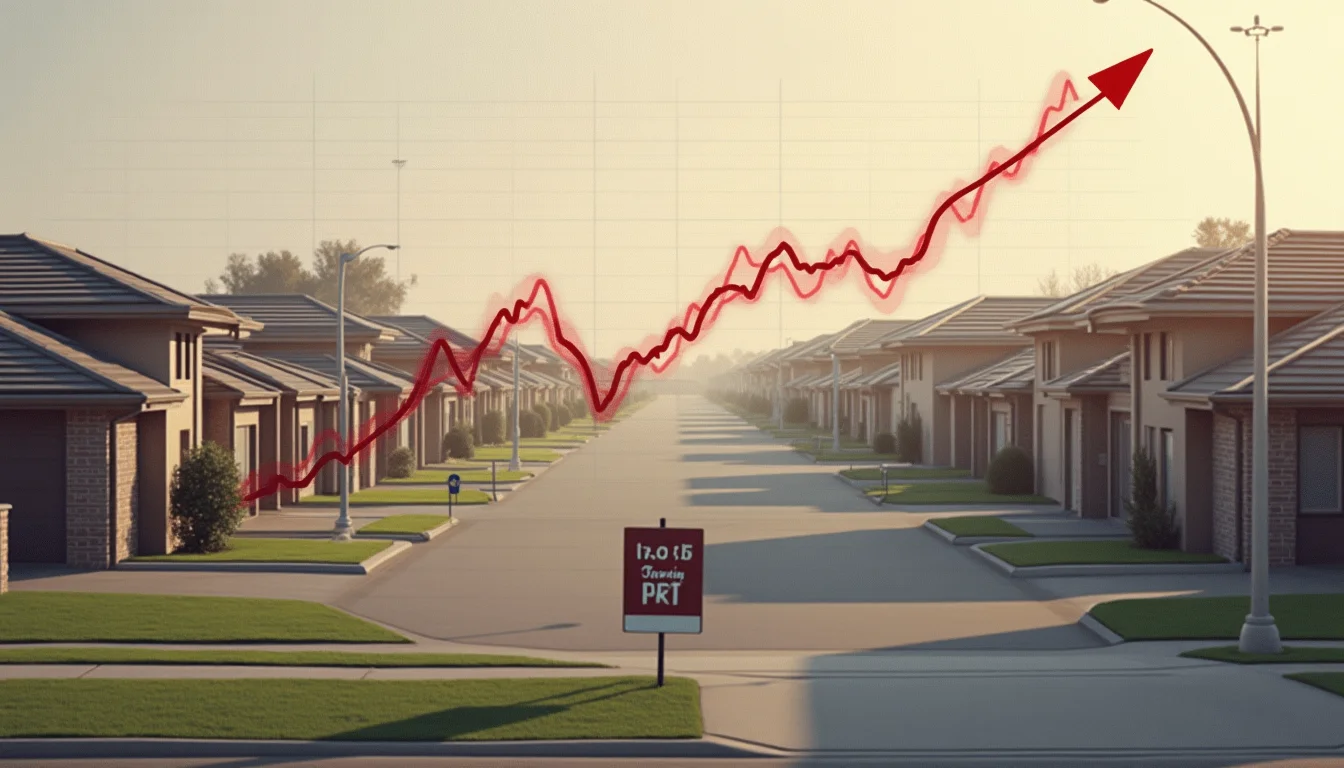
Australia's Mortgage Approval Cliff: How Credit Availability Turns Before Prices Do
Across every major property bust of the past four decades, the withdrawal of credit availability preceded price declines by months or years — and Australia's current lending indicators are tracing a familiar path.

Nasdaq's 10-Month Divergence: 4% From Record High
The Nasdaq's failure to reclaim its October 2025 record high, set against a backdrop of rising term premiums and fresh Fed rate-hike speculation, mirrors the yield-curve dynamics that quietly undermined equity valuations in the final years of the Dot-Com Bubble.

AI Data Centre Spending Draws Investor Scrutiny as Bloomberg Weekend Covers Markets Outlook
The 1998–2002 telecom bubble funded genuinely transformative infrastructure before collapsing under overcapacity and fraud, and today's AI data centre buildout is following a strikingly similar displacement narrative.

Australia's Net Overseas Migration Inflection: When the Demographic Engine That Drove Property Prices Goes Into Reverse
Australia's property market has been structurally reliant on record net overseas migration to sustain demand — and history shows that when migration assumptions built into asset prices prove wrong, corrections can be swift and severe.

Korean Chip Leveraged ETF Trading Collapses as Mandatory Mock Trading Course Cools Retail Investor Fervor
The rapid abandonment of Korean semiconductor leveraged ETFs by retail day traders illustrates how geopolitical supply disruptions can trigger the kind of cascading, sentiment-driven liquidations last seen in the hours before Black Monday 1987.

Lawmakers Rushed to Regulate NFTs After the Crash — And Ordinary Collectors Paid the Price
When NFT trading volumes collapsed by more than 97% from their 2022 peak, the political response that followed imposed compliance costs and legal uncertainty that fell hardest on small participants rather than the promoters who profited most.
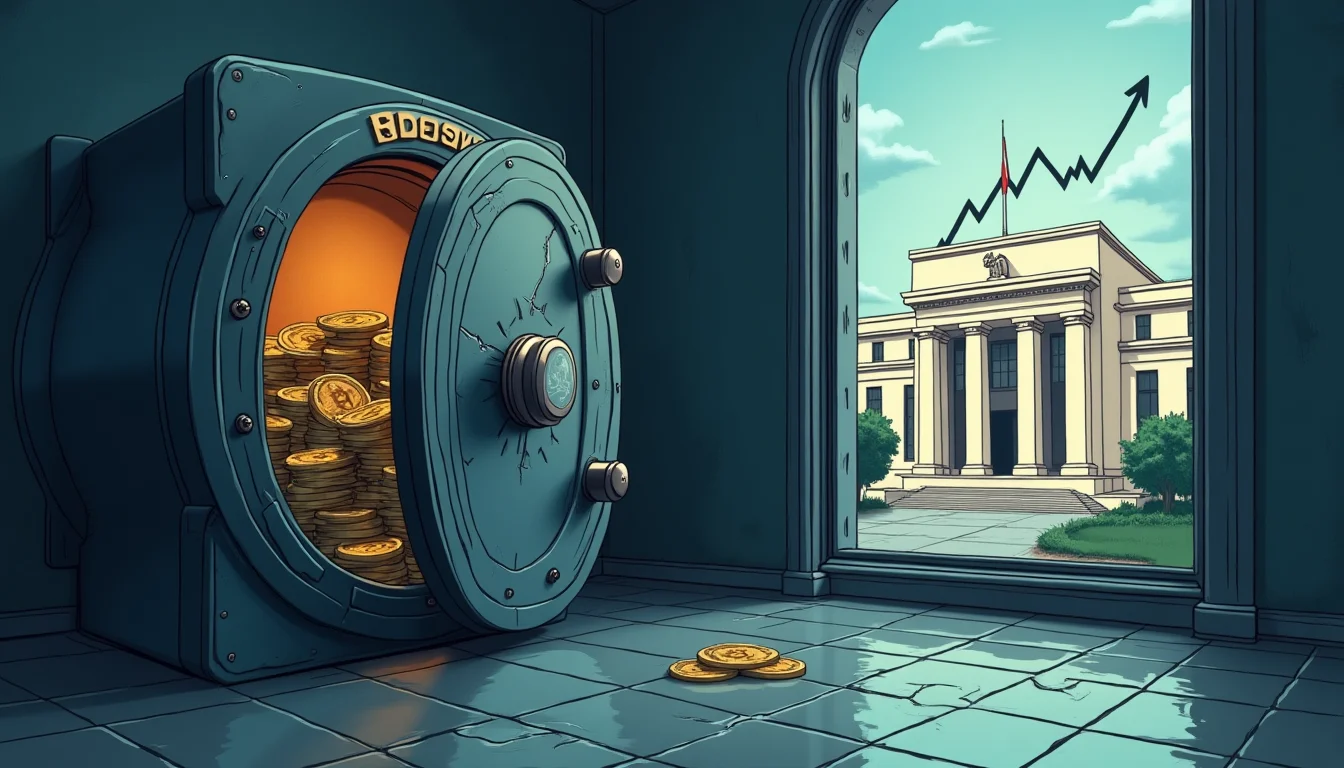
Fed's Hammack Signals Rate Hike, Raising Questions About Stablecoin Reserve Stability
As Federal Reserve officials signal renewed rate hikes in August 2026, the interest-rate assumptions baked into stablecoin reserve portfolios face their most serious test since the 2022 Terra/LUNA collapse.

Australia's Debt-Servicing Trap: How Rising Interest Costs Erode Household Capacity Without Prices Needing to Fall
When debt-servicing costs consume an outsized share of household income, property markets can stall, crack, or collapse without any single dramatic price shock — a mechanism visible in Sweden 1992, Canada 2017, and Australia today.

Carry Trades, Treasury Yields, and Currency Interventions: A Guide to Wall Street's Hot Debates
As gold holds near $4,600 and Wall Street debates the viability of global carry trades, the currency intervention regimes propping up today's capital flows bear uncomfortable structural similarities to the gold-standard distortions that amplified the 1929 collapse.
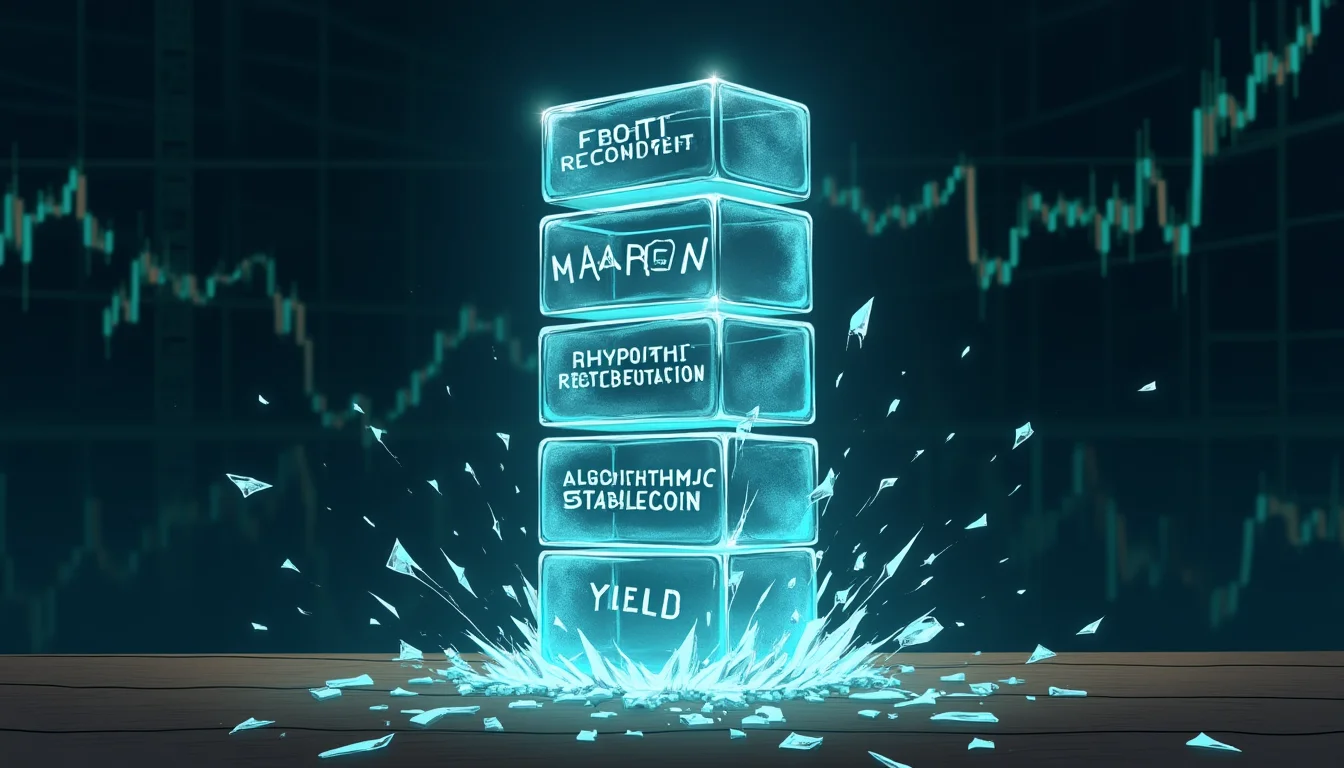
BofA Strategist Stands by Bearish S&P 500 Target Amid Wall Street Optimism, Citing Leverage and Credit Risks
The 2020–2022 cryptocurrency bubble was not merely a story of speculative enthusiasm — it was a credit-driven inflation machine, where margin lending, rehypothecated collateral, and algorithmic stablecoins created a fragile tower of debt that collapsed with historic speed.