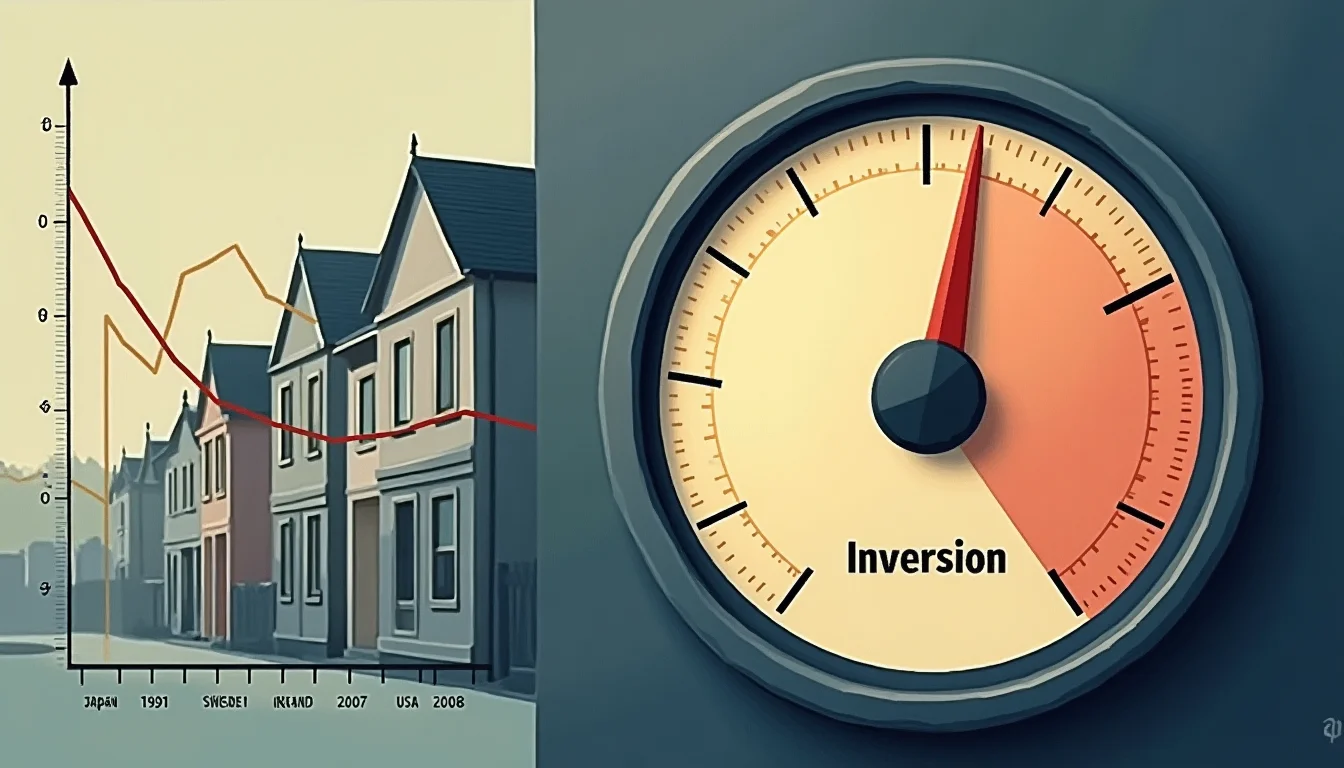
There is a number that property markets would rather you not calculate. It sits at the intersection of two figures that are publicly available, updated constantly, and almost never discussed together in the same sentence: the gross rental yield on residential property and the prevailing yield on a 10-year government bond. When the gap between them turns negative — when the risk-free rate exceeds what landlords collect in rent — the market is, by definition, pricing property on hope rather than income. According to the Bubblepedia Japanese Asset Price Bubble entry, Japanese residential yields in major cities had compressed to levels well below bond rates by the late 1980s, a condition that persisted for several years before the Nikkei and land price collapse of 1991–1992 destroyed decades of accumulated wealth.
That episode was not unique. It was a template.
What the Yield Gap Actually Measures
The rental yield-to-bond yield spread — sometimes called the property risk premium — answers a deceptively simple question: what extra return does an investor receive for accepting illiquidity, maintenance costs, tenant risk, and leverage, compared with simply buying a government bond? In a rationally priced market, property should offer a premium above the risk-free rate to compensate for those additional risks. When that premium disappears, or inverts, the market is implicitly relying on capital appreciation to justify ownership. Investors are no longer buying an income stream; they are buying a price.
This distinction matters enormously. Income-based valuations are anchored to something real — what tenants can afford to pay. Appreciation-based valuations are anchored to what the next buyer believes the asset is worth, which is itself anchored to what the buyer after that will pay. That is the structural definition of a speculative dynamic, and it is precisely what the yield gap measures in real time.
When gross rental yields fall below 10-year government bond rates, property markets are no longer pricing income — they are pricing a narrative. History shows narratives have a finite lifespan.
Four Crashes, One Signal
The pattern appears with uncomfortable regularity across the major property crashes of the past four decades.
In Japan, urban land prices rose more than fourfold between 1980 and 1990. By the peak, gross yields on Tokyo residential property had fallen to the low single digits while Japanese Government Bond yields sat meaningfully higher. The spread had not merely compressed — it had inverted. When the Bank of Japan tightened policy in 1989 and 1990, the income case for owning property at prevailing prices simply did not exist. Land prices fell for 15 consecutive years.
In Sweden, a credit deregulation cycle in the mid-1980s drove a sharp expansion in mortgage lending and a corresponding surge in property prices. By 1990, Swedish residential yields had compressed sharply while government bond yields — elevated by inflation-fighting monetary policy — exceeded what landlords could collect in rent. The correction between 1991 and 1993 saw real property prices fall by roughly 25–30 percent in major cities, triggering a banking crisis that required government intervention.
In Ireland, the yield gap inversion was among the most extreme recorded in a developed market. By 2006, gross yields on Dublin residential property had fallen to approximately 3 percent while Irish government bonds — before the sovereign spread widened — yielded more. The construction sector accounted for a disproportionate share of GDP, and credit growth was running at multiples of the European average. The subsequent correction erased more than half of peak nominal values in many segments of the market. The Irish property bubble remains one of the most studied examples of yield-gap inversion preceding catastrophic correction.
In the United States in 2006–2007, the dynamic was complicated by the prevalence of owner-occupation and the securitisation of mortgage risk, but the underlying income signal was the same. Cap rates on residential investment properties in bubble markets — Florida, Nevada, California, Arizona — had compressed to levels that made no sense against prevailing Treasury yields unless prices were assumed to keep rising indefinitely. When they stopped, the consequences extended far beyond property into the global financial system.
Australia's Position in the Cycle
Australia's property market has been a subject of sustained analytical interest for more than a decade, and the yield gap is central to that scrutiny. For detailed tracking of Australian property bubble indicators, including current yield spread data, the Bubblepedia bubble-watch dashboard provides regularly updated metrics. The structural features of the Australian market — high household debt, concentrated banking exposure to mortgages, and a significant investor ownership share — mean that yield-gap dynamics carry particular systemic weight.
Gross rental yields in Sydney and Melbourne have historically sat in ranges that, at various points in the past decade, have offered only a thin premium — or no premium at all — over Commonwealth Government Securities. The Reserve Bank of Australia's rate tightening cycle that began in 2022 materially shifted the bond yield side of the equation, compressing whatever spread remained. For investors assessing where Australian housing sits in the historical cycle, tracking the Australian property market context alongside bond rate movements provides the most complete picture of current risk.
The comparison with the Japanese property bubble versus US housing 2008 is instructive here: both episodes featured extended periods of yield-gap inversion before the eventual correction, and in both cases the inversion was rationalised by market participants as a permanent feature of a supply-constrained, high-demand environment.
Why Participants Ignore the Signal
The yield gap is not a secret. It is calculable by anyone with access to a property listing and a financial data terminal. Yet it is consistently dismissed during bubble phases, for reasons that are themselves diagnostic of speculative excess.
The most common rationalisation is that capital growth will compensate for the income shortfall. This is circular: it assumes the condition causing the problem — rising prices — will continue indefinitely to justify the condition it has created. A second rationalisation is tax treatment; in Australia, negative gearing provisions allow investors to offset rental losses against other income, which shifts part of the yield gap cost onto the public balance sheet and reduces the immediate pain of holding a loss-making asset. A third is the narrative of structural undersupply, which may be partially true but which has been invoked to justify elevated valuations in every market that subsequently corrected, including Ireland and Spain.
None of these rationalisations change the underlying arithmetic. When risk-free rates exceed rental yields, capital is being misallocated at scale. History's verdict on that condition is consistent across geographies and decades: the longer the inversion persists, the more severe the eventual adjustment tends to be.
Reading the Signal Now
The yield gap is not a precise timing tool. Markets can sustain inversions for years, particularly when credit remains available and confidence is high. What the signal provides is not a date but a condition: a market that has moved from investment to speculation, from income to narrative, from fundamentals to momentum. Identifying that condition early — before the credit cycle turns, before sentiment shifts, before forced selling begins — is the analytical contribution that financial history consistently offers to those willing to look at the numbers that markets prefer to ignore.
The full historical context for these dynamics is catalogued in the Bubblepedia bubble encyclopedia and the historical timeline, which traces property cycle turning points from 1870 to the present.
See also: Australian Property Bubble vs US Housing Bubble 2008 — Why One Crashed and One Did Not.