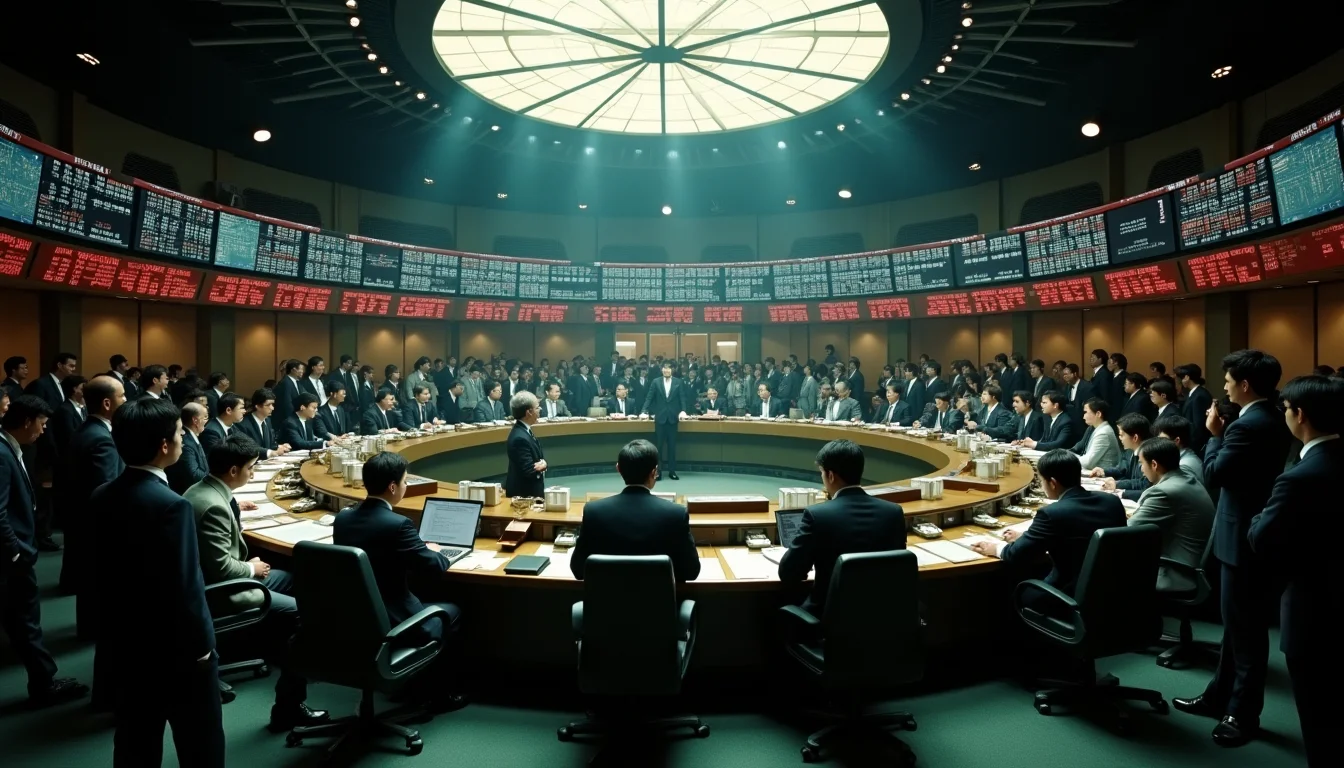
Japanese Asset Bubble (1986-1991)
At its peak, the land beneath the Imperial Palace in Tokyo was worth more than all the real estate in California. Japan's recovery took over 30 years.
By Twin · @TwinTowerCity·
Key Takeaways
- →At its 1989 peak, Tokyo's Imperial Palace grounds were valued higher than all California real estate combined.
- →Ultra-low interest rates from the Bank of Japan after 1985 fueled massive speculation in property and stocks.
- →The bubble burst in 1990 when the central bank raised rates and restricted real estate lending.
- →Japan's Nikkei stock index lost 63% from its peak and property values fell 70% in major cities.
- →The collapse caused three decades of economic stagnation, proving asset bubbles can permanently damage entire economies.
Peak Year
1989
Crash Year
1991
Location
Japan
Asset Class
Real Estate
Severity
What Caused the Japanese Asset Bubble?
The Japanese asset bubble of the 1980s was one of the most extreme speculative episodes in modern financial history, and its aftermath — a multi-decade economic stagnation known as the 'Lost Decades' — fundamentally shaped global economic thinking. The bubble's origins lay in the Plaza Accord of September 1985, when the G5 nations agreed to depreciate the US dollar against the Japanese yen and German mark. The yen appreciated approximately 50% against the dollar within two years, from roughly 240 yen per dollar to 120. This sharp appreciation threatened Japan's export-dependent economy, prompting the Bank of Japan to cut its discount rate from 5% to 2.5% between 1986 and 1987 — maintaining ultra-low rates for over two years. This cheap money, combined with financial deregulation and the liberalisation of capital controls, created the conditions for an extraordinary asset price inflation.
The Mania Phase
The Nikkei 225 stock index rose from approximately 13,000 in 1985 to a peak of 38,957 on December 29, 1989 — a gain of approximately 200% in four years. Land prices rose even more dramatically: the six largest cities saw commercial land prices increase approximately 300% between 1985 and 1990. At the peak of the bubble, the grounds of the Imperial Palace in central Tokyo were famously said to be worth more than all the real estate in California — while the precise calculation is disputed, it captured the absurdity of Japanese land valuations. Japanese corporations leveraged their inflated stock prices and land values to borrow massively, often using appreciated land as collateral to purchase stocks, and using appreciated stocks as collateral to purchase land — a circular dynamic that pushed both asset classes to extreme levels.
Peak Conditions
At the market's peak, Japan's stock market represented approximately 44% of global equity market capitalisation — compared to approximately 33% for the United States, despite Japan's economy being roughly half the size. The price-to-earnings ratio of the Nikkei 225 reached approximately 60-70, compared to historical norms of 15-20. Japanese property valuations implied that the entire country of Japan, with a land area approximately the size of California, was worth roughly four times the value of the entire United States. Japanese banks had become the world's largest by assets, with total bank assets approximately equal to GDP — an extraordinarily high ratio. Golf club memberships — a peculiarly Japanese speculative asset — traded at prices exceeding $1 million, with a market valued at approximately $200 billion. Nippon Telegraph and Telephone (NTT) alone had a market capitalisation exceeding the combined value of AT&T, IBM, Exxon, General Electric, and General Motors.
How Did the Japanese Asset Bubble Crash?
The Bank of Japan, belatedly recognising the dangers of the bubble, began raising interest rates in May 1989, eventually increasing the discount rate from 2.5% to 6% by August 1990. The stock market peaked on the last trading day of 1989 and entered a decline from which it would not recover for over 34 years — the Nikkei did not sustainably exceed its 1989 high until 2024. The decline was initially gradual, then accelerated in 1990: the Nikkei fell approximately 48% during 1990 alone. Land prices peaked slightly later, in 1991, and then entered a decline that continued for roughly 15 consecutive years, eventually falling approximately 70-80% from peak in the major cities. The total wealth destruction has been estimated at approximately $15 trillion — equivalent to roughly three years of Japanese GDP.
Aftermath and Recovery
Japan's post-bubble experience became the defining cautionary tale of modern economics. GDP growth averaged approximately 1% per year during the 1990s, compared to approximately 4% during the 1980s. Banks, burdened with non-performing loans backed by deflated collateral, became 'zombie banks' — technically solvent but unable or unwilling to lend productively. The government responded with fiscal stimulus — repeatedly cutting taxes and increasing public spending — that prevented a depression but generated enormous government debt, which grew from approximately 60% of GDP in 1990 to over 200% by 2010. The Bank of Japan eventually reduced interest rates to zero in 1999 and pioneered quantitative easing in 2001 — policies that would later be adopted by central banks worldwide in response to the 2008 financial crisis.
Lasting Legacy
The Japanese bubble and its aftermath provided the most important case study for subsequent central bank responses to asset price collapses. Ben Bernanke, before becoming Federal Reserve Chairman, studied Japan's experience extensively and explicitly designed the Fed's 2008-2009 crisis response to avoid what he viewed as Japan's mistakes — particularly the Bank of Japan's initial reluctance to ease aggressively. The concept of a 'balance sheet recession' — developed by economist Richard Koo to explain Japan's stagnation — became influential in understanding how private sector deleveraging can overwhelm monetary policy stimulus. Japan's experience also raised fundamental questions about whether asset bubbles, once they reach sufficient scale, can be deflated without triggering prolonged economic damage — questions that remain relevant as other economies face their own post-bubble adjustments.
The Plaza Accord's Role
The Japanese asset bubble cannot be understood without the Plaza Accord of September 1985. The agreement, signed at the Plaza Hotel in New York by the finance ministers of the United States, Japan, West Germany, France, and the United Kingdom, was designed to depreciate the US dollar against the yen and the Deutsche Mark to address American trade deficits. Within two years, the yen had appreciated from approximately 240 to 120 against the dollar — a doubling in value that threatened to crush Japanese export competitiveness.
The Bank of Japan responded by cutting its discount rate from 5 percent in early 1986 to 2.5 percent by February 1987, the lowest level in Japanese postwar history. The cuts were intended to support exporters and offset the deflationary impact of the stronger yen. They had a different effect. Japanese banks, awash with cheap funding and constrained by domestic regulations from many forms of speculation, channelled the credit into the only assets that seemed to offer infinite upside: Japanese real estate and equities.
By the 1989 peak, the Nikkei had risen from approximately 13,000 in early 1986 to 38,915 — a tripling in less than four years. Tokyo land prices had risen even more dramatically.
The Zaitech Phenomenon
Zaitech, a Japanese term combining the words for finance and technology, described the practice of corporations abandoning their core operating businesses to speculate in financial markets. By the late 1980s, Japanese companies were not so much manufacturers that happened to invest spare cash as investment vehicles that happened to manufacture things. Toyota's financial division at one point generated more profit than its core automotive business. Steel companies, shipbuilders, and electronics manufacturers all established treasury operations that traded equities, real estate, and increasingly exotic structured products on a scale that dwarfed their operating activities.
When a manufacturer makes more money speculating than building, the country has stopped being an economy and started being a casino with industrial side businesses.
The justification was straightforward. Industrial returns were modest and required substantial capital expenditure. Financial returns appeared limitless and required only access to cheap funding, which was abundant. Cross-shareholdings between banks, insurers, and industrial companies — the keiretsu structure — meant that rising asset prices increased the equity capital of every participant simultaneously, creating a self-reinforcing loop that resembled a perpetual motion machine.
The Land Price Absurdity
By 1990, the grounds of the Imperial Palace in central Tokyo were estimated to be worth more than the entire state of California. The total value of Japanese real estate was calculated at four times the value of all real estate in the United States, despite Japan having a land area roughly the size of Montana. A square metre of prime commercial land in the Ginza district traded for the equivalent of $1.5 million.
Golf club memberships became a separate asset class. The Koganei Country Club in Tokyo had memberships trading at the equivalent of $3 million each, with a futures market in golf memberships that had higher trading volume than many small-cap stocks. The Nikkei Golf Membership Index became a closely watched economic indicator in its own right.
The Lost Decades
The bubble's collapse, beginning with the Bank of Japan's rate hikes in 1989 and accelerating through 1990, did not produce a sharp clearing crisis followed by recovery. It produced thirty years of stagnation. The Japanese policy response — forbearance towards insolvent banks, inadequate monetary stimulus until the late 1990s, and a series of small fiscal packages that never reached the scale needed to restore demand — created what economists now call zombie banks and zombie firms, kept alive by ongoing credit but unable to invest, hire, or grow.
The lessons of Japan's lost decades shaped the responses of every subsequent central bank to financial crises. Ben Bernanke, an academic specialist in the Great Depression, explicitly cited Japan's mistakes as the reason for the Federal Reserve's aggressive response to the US housing bubble of 2008. Whether that response avoided Japan's fate or simply postponed it remains contested.
Recommended Reading

Key Statistics
Nikkei Peak
38,915.87 (Dec 29, 1989)
Recovery Time
34 years (to Feb 2024)
Tokyo Commercial Land
~¥30M+/sqm in central districts
Property Decline
~80% over 15 years (urban land)
JP Property vs US
Estimated 4x total US property value at peak
Golf Memberships
Up to $3 million
Warning Signs
- Central bank lowering rates to protect exporters rather than financial stability
- Banks using inflated property as collateral for more property loans
- Imperial Palace land worth more than all California real estate
- Belief in Japanese economic exceptionalism and permanent superiority
- Golf club memberships trading as million-dollar financial assets
Timeline
1985
Plaza Accord — BOJ cuts rates to offset yen appreciation
1986-89
Property and stock prices enter parabolic phase
Dec 1989
Nikkei peaks at 38,915.87 — all-time high
May 1989
BOJ begins raising interest rates
Sep 1990
Nikkei falls 38% in nine months
1991-2005
Property values fall 80-90% over 15 years
Feb 2024
Nikkei finally exceeds 1989 level — 34 years later
Lessons Learned
Japan's bubble teaches that central bank policy can create asset bubbles of civilization-altering scale, and that the hangover can last decades. The self-reinforcing loop of property values supporting bank lending supporting more property purchases is the same mechanism that drove the 2008 US housing crisis. Japan also proves that 'this time is different' thinking — the 1980s conviction that Japanese management techniques, work ethic, and economic planning represented a permanently superior model — is always wrong at the extremes.
Frequently Asked Questions
What caused the Japanese asset bubble of 1986-1991?
The Bank of Japan's ultra-low interest rates (2.5% by 1987) following the Plaza Accord made borrowing extremely cheap. Easy credit fueled speculation in real estate and stocks. Deregulation of financial markets allowed excessive lending. Banks used inflated property as collateral for more loans, creating a dangerous feedback loop that drove asset prices to unsustainable levels.
How much did Japanese property prices rise and fall during the bubble?
Commercial land prices in Tokyo rose 245% between 1985-1990, while residential prices increased 165%. After the bubble burst, commercial property values fell 87% from peak to trough by 2005. The Nikkei stock index crashed from 38,957 in December 1989 to under 8,000 by 2003, losing over 80% of its value.
What were the warning signs of the Japanese asset bubble?
Extreme price-to-income ratios made Tokyo housing unaffordable for average workers. The Imperial Palace grounds were valued higher than all California real estate. Banks loosened lending standards dramatically. Corporate investment shifted from productive assets to speculation. Price increases far exceeded economic fundamentals like GDP growth and wages, creating unsustainable market conditions.
What lessons does the Japanese asset bubble teach investors?
Asset bubbles can persist longer than expected but always end badly. Ultra-low interest rates can create dangerous speculation. Diversification across asset classes and geography is crucial. When prices disconnect from fundamentals, exercise extreme caution. Recovery from major bubbles takes decades, not years. Don't assume 'this time is different' mentality.
Current Relevance
Japan's experience is directly relevant to every major property market displaying similar characteristics: Australia, Canada, China, and New Zealand. The question of whether central banks can ever unwind asset bubbles without causing prolonged economic stagnation remains unanswered. China's current property crisis may follow the Japanese template.
Explore gold storage options
Gold is not a guaranteed hedge against crashes. Prices can fall; storage fees and custody risks also matter.
Affiliate link: Bubblepedia may earn a commission. Not a recommendation; investment values can fall.
Recommended Reading
Recent Analysis
Japan's AI Trade Rout: When Sector Rotations Trigger Cross-Border Equity Crashes
6 Nov 2026
Bond Trader's 16-Year Sentence: Everything Bubble Case Study
12 Sept 2026
Migration Reversals & Housing Market Corrections
5 Sept 2026
Indonesia's Rupiah Defense Mirrors Thailand 1997
8 June 2026
Investment Borrowing Down 40% Since 2017
18 May 2026
Get Bubblepedia in your inbox
Asset bubbles and market-history insights in your inbox.