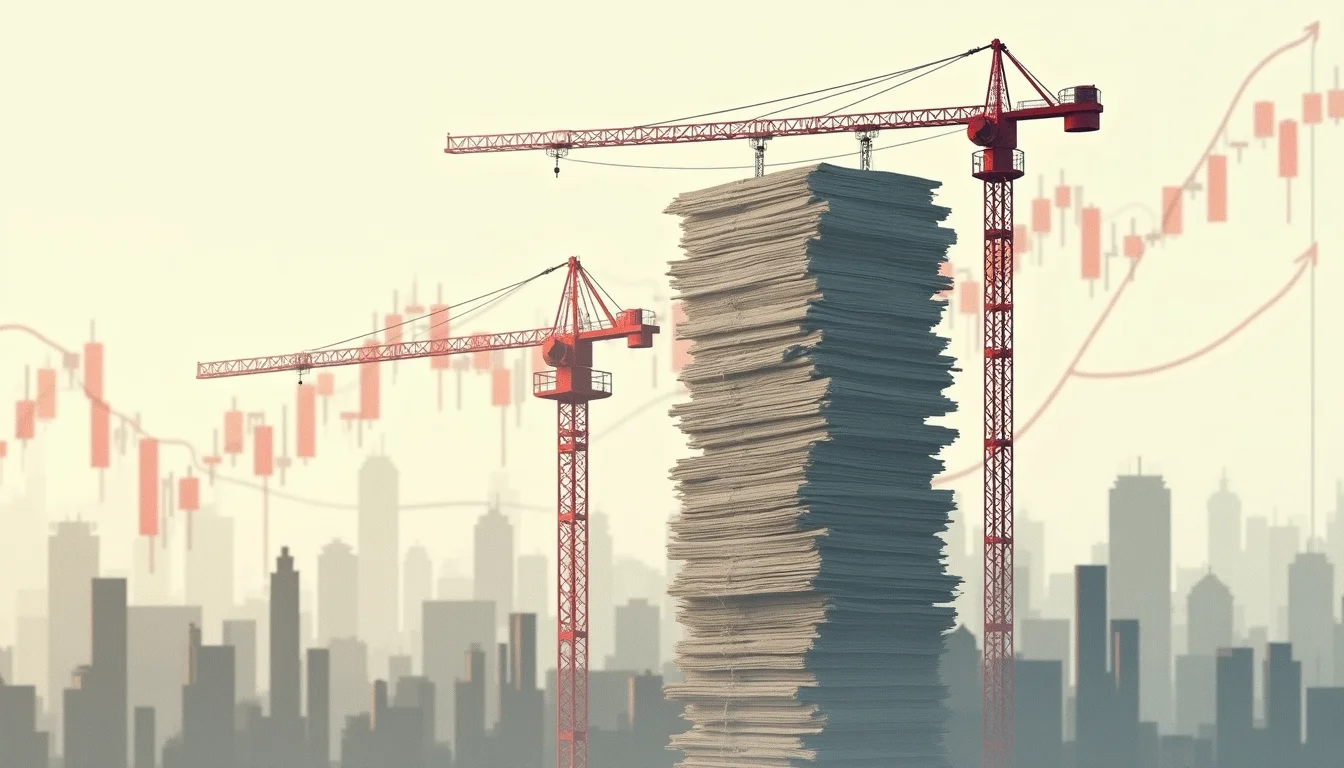
A Trade Story That Can't Escape China's Property Math
According to Bloomberg Markets, global trade flows have proven more resilient than a decade of tariffs and populist politics suggested they would be. For China, that resilience is not incidental — it is policy necessity. With the property sector that once generated a substantial share of GDP still working through the largest asset-value contraction of the modern era, Beijing has leaned harder on exports and manufacturing to fill the growth gap. The question markets have not resolved is whether global demand can absorb that substitution indefinitely, or whether the mechanism that broke Chinese property — not the asset itself, but the financing structure underneath it — poses a risk that extends well beyond China's borders.
The Mechanism: Deposits as Shadow Leverage
What made China's property boom structurally unusual was not simply that prices rose, or that developers borrowed heavily — that happens in most property cycles. It was the specific financing loop that developers like Country Garden and China Evergrande Group built around pre-sales. Apartments were sold to buyers years before completion. Those buyer deposits — not bank loans, not bond proceeds — became the primary working capital developers used to acquire the next parcel of land and start the next project. The model only functioned as long as sales volume kept growing, because each new project depended on deposits from the project after it. This is a textbook example of what economist Hyman Minsky called Ponzi finance: a structure in which cash flow from new commitments is required to service obligations incurred by earlier ones, rather than from the underlying asset's own return.
By treating household deposits as off-balance-sheet construction financing, developers effectively converted tens of millions of ordinary Chinese families into unsecured creditors of a leveraged corporate structure, without those families ever appearing on a bank's loan book or in official debt statistics. That is the structural analogy worth sitting with: the risk was never confined to developer balance sheets. It was distributed across the household sector in a form that looked, to most buyers, like ordinary home ownership.
Evergrande as the Mechanism's Breaking Point
Evergrande, founded by Xu Jiayin in 1996, became the largest practitioner of this model, growing to a vast nationwide portfolio of projects before its 2021 default. Company filings put total liabilities above $300 billion, a figure that includes not just bonds and bank debt but the deferred obligation to deliver pre-sold, unfinished apartments — an obligation estimates place in the tens of millions of units nationally, though the exact figure remains contested given inconsistent local reporting. Separate estimates of vacant, completed-but-unsold apartments also run into the tens of millions, though methodologies vary widely and official Chinese statistics on vacancy are notoriously incomplete. National Bureau of Statistics data show prices in major cities down roughly 30% from their peak, a decline that has persisted for years rather than resolving in the sharp correction-and-recovery pattern typical of Western property cycles.
The slow-motion character of the unwind is itself structurally significant. Because so much value was tied up in uncompleted construction rather than liquid assets, there was no single clearing event — no 2008-style collapse of a funding market overnight. Instead, the mechanism has failed in stages: pre-sale volumes collapse, developers cannot complete existing commitments, local governments and state-linked entities step in selectively to finish stalled projects and preserve social stability, and household wealth erodes gradually rather than catastrophically. Various estimates have placed total Chinese real estate value at an enormous figure at its peak — by some accounts larger than the entire US residential and commercial property markets combined — which gives some sense of the scale still working through this adjustment.
The Historical Parallel
This structural pattern — collateral or cash-flow obligations hidden inside what looks like ordinary consumer transactions, requiring perpetual volume growth to avoid collapse — is the defining feature of the Read the full Chinese Property Bubble and Evergrande Crisis (2000-Present) entry in the Bubblepedia Encyclopedia. It shares structural DNA with Japan's late-1980s property and banking bubble, where cross-held collateral valuations inflated balance sheets that were never stress-tested against falling prices, a comparison explored in Japanese Property Bubble vs US Housing 2008. The difference is one of distribution: Japan's excess leverage sat primarily inside banks; China's sits partly inside households, through pre-paid deposits for apartments that may never be finished.
Why This Still Matters to Global Markets
China's property contraction interacts directly with the dynamics reflected in this week's record $728 billion US Treasury auction, where yields hit multi-decade highs even as demand held up. A Chinese economy leaning more heavily on export surpluses to offset lost property-sector growth has direct implications for global trade balances, currency management, and the recycling of trade surpluses into foreign bond markets — precisely the kind of cross-border capital flow dynamic tracked in macro analysis of sovereign debt and currency conditions. A prolonged Chinese property drag, absorbed partly through export competitiveness, is one of the more underappreciated channels by which this crisis continues to shape global bond and currency markets years after Evergrande's initial default.
The defining feature of a Ponzi-structured financing mechanism is not fraud at the top — it is that ordinary participants never realize they are creditors until the growth stops.
Readers tracking how these structural risks compare across asset classes can review current conditions at Bubble Watch or browse related episodes in the full Bubblepedia encyclopedia.
See also: Bond Vigilantes 1994 vs Global Bond Bubble 2020 — Fixed Income Extremes Compared.