Market Bubble Analysis & Commentary
Daily commentary on the speculative excesses, valuation extremes, and structural risks shaping global markets right now. Articles cover equities, property, crypto, commodities, and the macro forces that drive boom-and-bust cycles, with frequent reference to historical parallels documented in the encyclopedia. Each piece is written to translate complex market signals into clear, actionable context for long-term investors.
Analysis falls into four recurring categories — historical-parallel pieces that map a current market condition onto a documented past bubble; crypto-market-cycle notes that track halving positioning, stablecoin reserves, and exchange-concentration risk; property-market-risk pieces that examine credit availability, household debt, and rental-yield gaps; and global-market-risk articles that focus on yield-curve signals, central-bank divergence, and sovereign-debt sustainability. The category badge on each card identifies which lens the article uses.
Every article is written to a strict editorial standard. Specific numbers must be traceable to live indicator data or supplied source text. Speculative phrasing is avoided. Articles below an 800-word threshold are rejected and regenerated. Pieces flagged for review are held back rather than published with disclaimers. Use this feed to track how today's risks are evolving and where the next mania may already be forming.
The pipeline that produces these articles draws on a structured set of inputs: a daily-refreshed table of macro indicators (Shiller CAPE, Buffett Indicator, US 10-year yield, MOVE index, Bitcoin dominance, stablecoin reserves, household debt-to-GDP, and roughly forty others), a curated news feed scraped from central-bank statements, regulatory filings, and major financial outlets, and the full encyclopedia of historical bubbles for parallel-matching. The model is instructed to flag any indicator reading that crosses a documented historical threshold and to anchor its analysis in that signal rather than in sentiment or narrative.
Editorial independence matters. Bubblepedia does not accept sponsored placements inside analysis articles, and affiliate links — where they appear — are confined to clearly labelled blocks separated from the body copy. We do not short or hold leveraged positions in any asset discussed, and we do not publish price targets or trade recommendations. The goal is structural understanding: helping readers recognise the shape of a bubble before it bursts, and the shape of a recovery before it begins. Bookmark this page or subscribe to the weekly digest to follow the analysis as it evolves.

US Exchanges Move Toward Round-the-Clock Stock Trading, Testing Market Infrastructure
As US equity markets move toward round-the-clock trading, the reserve mechanics behind Tether and Circle's stablecoins — the assets that already trade 24/7 — remain only periodically verified, a mismatch that echoes the valuation opacity of the 2021 NFT bubble.

Australia's Household Debt Load Has Outpaced Income Growth for Three Consecutive Decades
Australia's household debt-to-income ratio has climbed almost continuously since the early 1990s, a trajectory that historically precedes property market corrections rather than causes them directly.

Asian Bond Yields Hit 2022 Highs: The 1929 Currency Trap
Rising South Korean and Japanese bond yields reveal a currency-defense strategy under strain, echoing the failed international monetary coordination that preceded the 1929 crash.

How Crypto's Hidden Leverage Collapsed in 2022
The 2020-2022 crypto crash was not a simple price collapse but a credit event, as hidden leverage across exchanges, lenders, and algorithmic stablecoins unwound in a chain reaction that destroyed over $2 trillion in value.

Crypto's Exchange Concentration Risk Lingers Two Years After FTX's Collapse
Despite years of promises to diversify trading infrastructure, crypto markets still depend on a handful of offshore exchanges — a fragility with direct parallels to the concentrated liquidity pools that broke during the 2020 DeFi Summer bubble.

Australian Auction Clearance Rates Fall as Credit Tightens
As Australia's central bank moves toward a fourth rate hike and its housing market cools, foreign capital is pouring into a narrow band of US tech megacaps even as global appetite for sovereign debt weakens — a divergence pattern that has preceded past market dislocations.
Hedge Funds Slash Bullish Yen Bets After BOJ Skips Firm Rate-Hike Signal
Hedge funds trimming bullish yen bets after the Bank of Japan's cautious rate signal are exhibiting the same forced-unwind mechanics that turned GameStop into a 2,740% short squeeze in January 2021.

Bitcoin's Four-Year Rhythm Faces Its Sternest Test 29 Months After the 2024 Halving
Bitcoin is now well past the historical post-halving peak window, forcing a reckoning with whether the four-year cycle still applies as macro conditions tighten and institutional flows dominate price action.
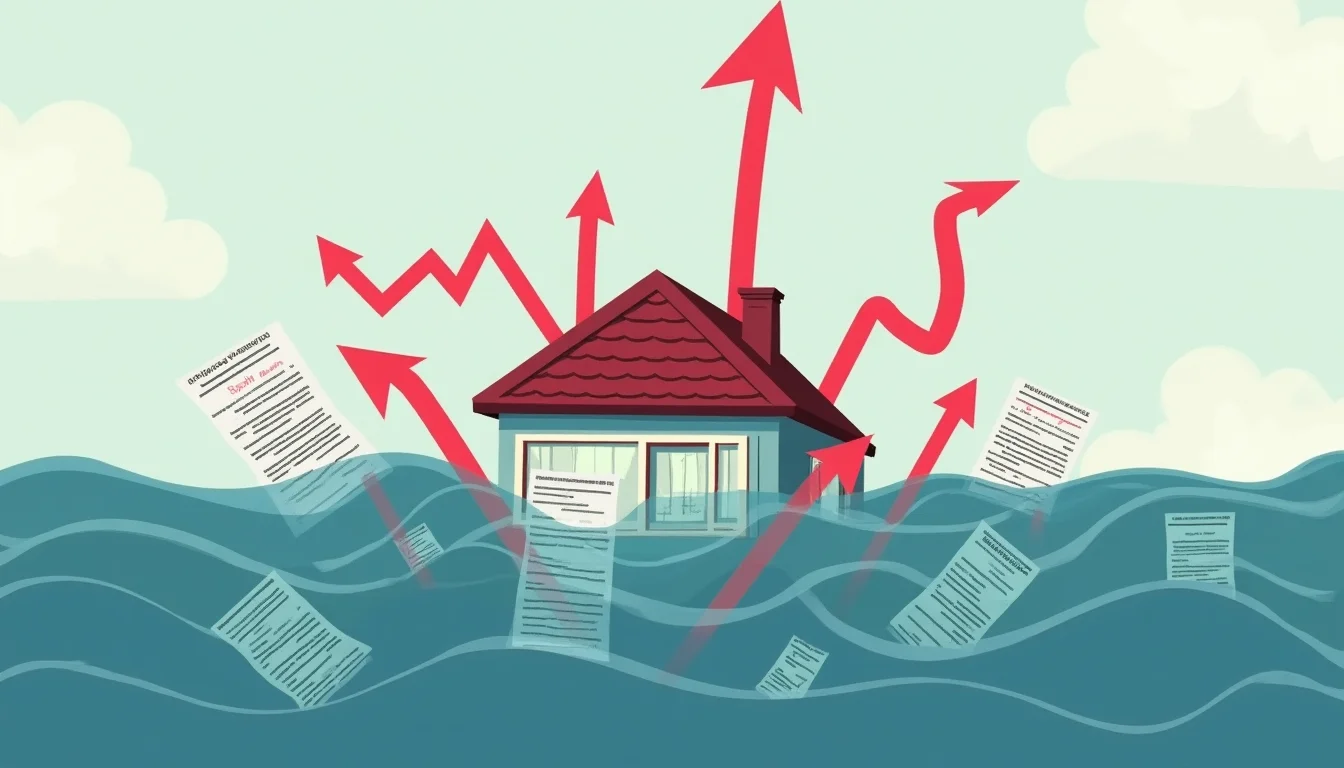
Japan's 1989-1990 Rate Hikes: Credit Risk Lesson for Australia
As the RBA flags a cash rate that could top 4.85%, history shows credit-availability turns — not price falls themselves — are what actually detonate property bubbles.

Fed's Hammack: Treasury Yields Reflect Growth, Debt Path, and Rate Outlook
A Federal Reserve official's warning that bond yields already reflect debt and inflation risk is colliding with a narrow, concentration-driven stock rally reminiscent of debt-monetization bubbles past.

Romania Offers Higher-Yield Bonds to Blood Donors as Countries Get Creative on Debt
Romania's new retail bond offering echoes the yield-chasing psychology that fueled DeFi Summer in 2020, when Compound's COMP token turned lending into a speculative gold rush before governance tokens lost more than 90% of their value.

US New-Home Inventories Surge as Sales Stall and Builders Cut Prices
Canada's 2024 decision to cut immigration targets after a decade of population-driven housing demand offers a live test of what happens when migration-fuelled property markets meet a demographic reversal.

Gold Slips as Iran Standoff and Oil Surge Fuel Fed Rate-Hike Bets
As the Iran standoff drives oil and rate-hike bets higher, equity markets are pricing an AI boom that assumes higher rates won't matter — a conviction pattern that echoes the 2021 meme stock mania.

Asian Bonds, Stocks Fall as Oil Fuels Inflation Fears Since 2009
Rising oil prices are pushing Asian bond yields higher and forcing both corporations and governments to confront a decade of debt accumulated on the assumption that rates would stay low forever.

Retail Crypto Buyers of 2017 and Today's AI Token Speculators: When Participant Composition Predicts Collapse
As AI-backed token sales echo the ICO mania's participant profile—retail investors chasing unvetted projects with minimal accountability—the 2017 collapse offers a stark warning about who absorbs losses when euphoria ends.

ARK's Tokenized Venture Fund Signals Institutional Shift Away from Mining as Miner Capitulation Looms
Bitcoin miners show signs of capitulation as institutional capital flows toward tokenized venture funds rather than mining operations, echoing the 2013 bubble's production-demand disconnect.

Bond Repricing Accelerates: 30-60 Days to Financial Stress
Japan's 10-year yield hits 1996 highs and global government bonds approach 4% as central bank policy divergence and inflation fears trigger a sovereign debt repricing that mirrors the structural fragility of the 2020–2021 SPAC bubble.

Turkish Fund Collapse Mirrors 2013 Pattern of Fraud and Regulatory Backlash
Turkey's $455,000-investor fund scam echoes the regulatory aftermath of Bitcoin's 2013 crash, revealing how rapid, unregulated financial innovation creates political pressure for harsh crackdowns that ultimately damage legitimate market infrastructure.
Stablecoin Reserve Opacity and the DeFi Summer Playbook: Why Crypto's Collateral Crisis Mirrors 2020
As stablecoin reserves face renewed scrutiny in 2026, opaque backing mechanisms and yield-chasing protocols replicate the structural fragility that defined DeFi Summer 2020—when $15 billion in total value locked collapsed under the weight of unsustainable promises.

Australia's Household Debt-to-Income Ratio Hits 190%: When Leverage Becomes Structural Fragility
Australian household debt-to-income ratios now exceed levels seen before the 2008 global financial crisis, mirroring structural vulnerabilities that preceded the Japanese property collapse of 1990 and the Irish housing bust of 2007.

Hunt for Bigbubble Casts Doubt on Radiant World's $1 Billion in Assets
As questions mount over Radiant Capital's $1 billion in assets amid currency volatility, central bank intervention regimes show signs of the same structural fragility that preceded the 1997 Asian crisis and the 2021 meme stock squeeze—when coordinated defense of unsustainable pos

The Pokémon Card Market's Leverage Problem: Why Modern Sealed Products Mirror the 2020-2022 Collapse
The 2026 Pokémon card surge shows classic late-stage bubble mechanics—FOMO-driven buying, supply constraints, and implicit leverage through speculative positioning—that echo the 2020-2022 collapse and warn of structural fragility in modern sealed products.
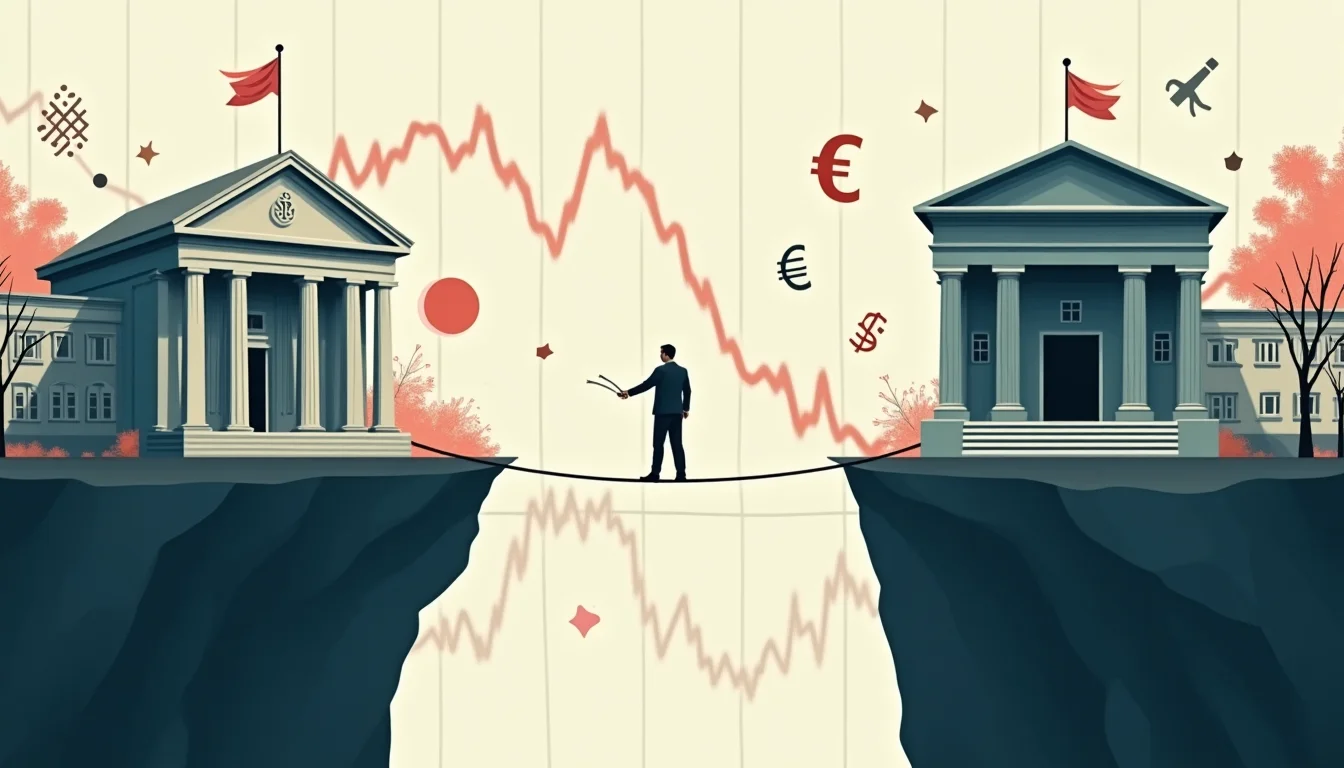
Central Bank Divergence and the Carry Trade Trap: Why Synchronized Policy Failure Precedes Market Crashes
As the Federal Reserve holds rates steady while the Bank of Japan and ECB diverge sharply, currency carry trades are re-inflating—mirroring the policy misalignment that triggered the 2014–2015 Chinese stock crash and setting conditions for a cascading liquidity event.
Semiconductor Rally Masks S&P 500 Concentration Risk
Seven mega-cap stocks now represent 33% of the S&P 500—the highest concentration in 50 years—driven by passive fund flows that automatically amplify the largest holdings, mirroring the structural dynamics that preceded the 1973-74 market crash.