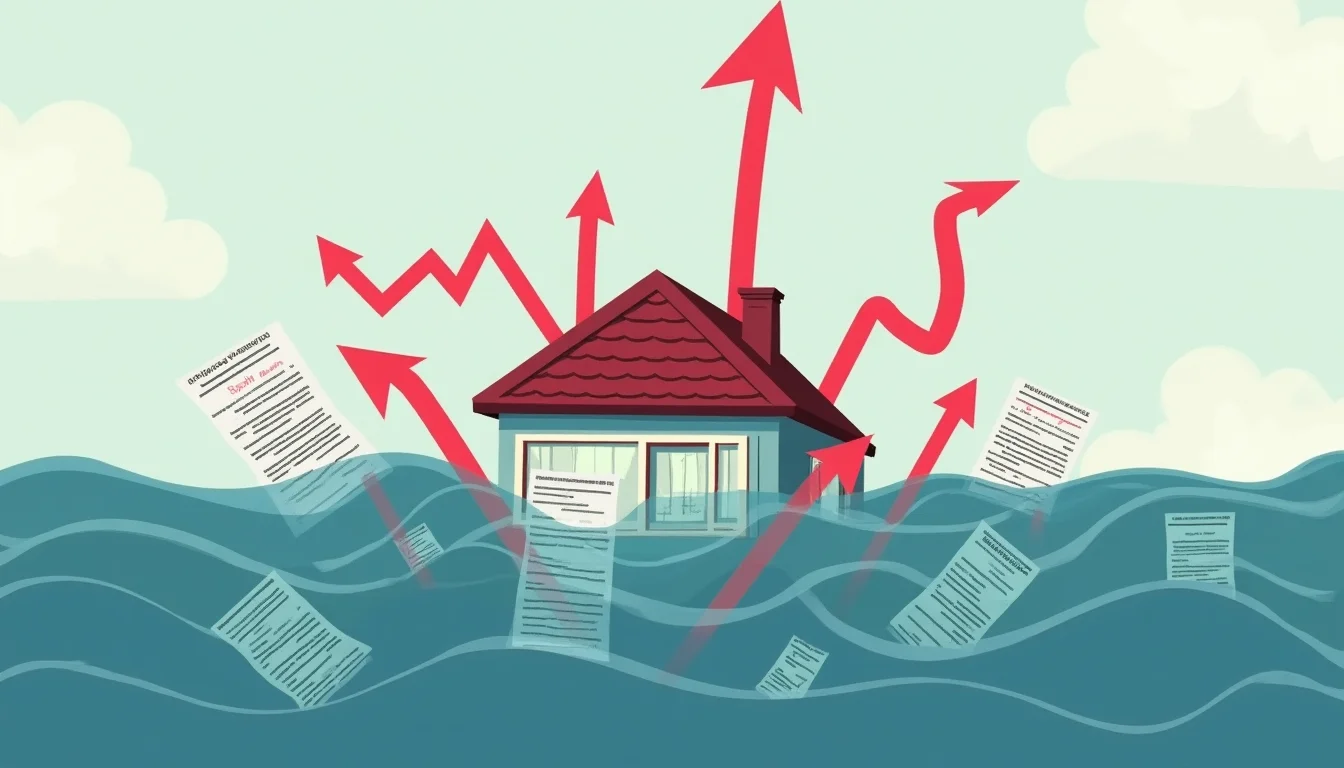
The Discount Rate That Broke Japan
Between May 1989 and August 1990, the Bank of Japan raised its official discount rate five times, from 2.5% to 6%. According to the Bubblepedia Japanese Asset Price Bubble entry, this tightening cycle did not immediately crash the Nikkei 225 — the index kept climbing into December 1989, peaking near 38,957. The real damage came 12 to 18 months later, once banks translated higher policy rates into tighter lending standards, reduced loan-to-value ratios, and a broader unwillingness to roll over speculative property credit. Prices didn't fall because buyers stopped wanting property. They fell because the marginal buyer could no longer get a loan on the terms the market had priced in.
This is the pattern this site's historical timeline keeps surfacing: property bubbles rarely end with a demand collapse. They end with a credit-availability turn — a shift from accommodating to restrictive lending that arrives after years of the opposite, and typically catches leveraged owners with the least room to absorb it.
Australia's Warning Signal
Australia may now be watching its own version of that mechanism assemble. According to Australian Property Forum, market pricing has begun to reflect the possibility of a double rate hike that would push the cash rate above 4.85% — a level that, combined with APRA's existing 3-percentage-point mortgage serviceability buffer, would require new borrowers to demonstrate they can service loans priced well into the high single digits. That buffer was designed precisely to prevent the kind of credit-availability whiplash Japan experienced, but it also means the practical effect of further hikes falls hardest on borrowers who took out loans when serviceability tests were calibrated to a much lower rate path.
The mechanism matters more than the headline number. A cash rate move from, say, 4.35% to 4.85% is a 50 basis point change in absolute terms, but its effect on credit availability is nonlinear: it can push borrowers who were marginally approved under previous serviceability tests into effective non-eligibility for refinancing, even if they have never missed a repayment. That is the credit-availability turn — not a rate rise itself, but the moment refinancing options narrow for households already holding variable-rate debt.
The historical lesson from Japan, and later from the US in 2006–2007, is that credit-availability turns are typically invisible in aggregate price data for 12 to 24 months before they show up in forced sales and auction withdrawal rates. By the time median prices reflect the tightening, the credit conditions that caused it have often already reversed further.
What the Turn Looks Like on the Ground
Early-stage stress in a credit-availability turn rarely appears as a market-wide statistic first — it shows up in individual forced-sale cases and structural gaps in how transactions are policed. According to Australian Property Forum, one Melbourne investor was reported to have sold an investment property after sustaining monthly losses of roughly $1,200, a scenario consistent with what happens when refinancing at a lower rate is no longer available and the holding cost of a negatively geared asset becomes unsustainable. Separately, Australian Property Forum reported that Victoria lacks the bidder-registration requirements now standard in NSW and Queensland auctions — a gap that becomes more consequential, not less, when fewer genuine bidders are competing for listings and price discovery at auction becomes less reliable.
Neither data point alone constitutes a bubble signal. Together, they resemble the texture of credit-tightening episodes historically: isolated forced sales, thinning bidder pools, and regulatory gaps that mattered less when credit was abundant becoming more consequential as it tightens.
Why It Matters
The comparison to Japan is instructive precisely because it is imperfect. Japan's credit-availability turn was compounded by a banking system that had extended loans against inflated collateral values and by a demographic profile already tilting toward contraction. Australia's household debt-to-income ratios are historically elevated, but its banking system operates under post-2008 capital and serviceability regimes that Japan's did not have in 1990. For readers tracking Australian property market conditions in real time, the more relevant question is not whether a crash of Japanese proportions is imminent, but whether the marginal borrower — the one who bought in 2021–2023 at the bottom of the rate cycle — now faces a refinancing gap that didn't exist eighteen months ago.
This is where credit-availability turns diverge from simple rate-rise stories. A borrower can absorb higher repayments for years if refinancing remains available at competitive terms. What breaks the arithmetic is when a lender's serviceability test, recalibrated to a higher assumed rate, effectively locks a borrower into their existing loan — removing the escape valve that made the debt sustainable in the first place. That is the mechanism worth watching in the months ahead, more than any single print of the cash rate itself. Readers can track live indicators of this dynamic on Bubble Watch and explore related historical cases across the full Bubblepedia encyclopedia.