Market Bubble Analysis & Commentary
Daily commentary on the speculative excesses, valuation extremes, and structural risks shaping global markets right now. Articles cover equities, property, crypto, commodities, and the macro forces that drive boom-and-bust cycles, with frequent reference to historical parallels documented in the encyclopedia. Each piece is written to translate complex market signals into clear, actionable context for long-term investors.
Analysis falls into four recurring categories — historical-parallel pieces that map a current market condition onto a documented past bubble; crypto-market-cycle notes that track halving positioning, stablecoin reserves, and exchange-concentration risk; property-market-risk pieces that examine credit availability, household debt, and rental-yield gaps; and global-market-risk articles that focus on yield-curve signals, central-bank divergence, and sovereign-debt sustainability. The category badge on each card identifies which lens the article uses.
Every article is written to a strict editorial standard. Specific numbers must be traceable to live indicator data or supplied source text. Speculative phrasing is avoided. Articles below an 800-word threshold are rejected and regenerated. Pieces flagged for review are held back rather than published with disclaimers. Use this feed to track how today's risks are evolving and where the next mania may already be forming.
The pipeline that produces these articles draws on a structured set of inputs: a daily-refreshed table of macro indicators (Shiller CAPE, Buffett Indicator, US 10-year yield, MOVE index, Bitcoin dominance, stablecoin reserves, household debt-to-GDP, and roughly forty others), a curated news feed scraped from central-bank statements, regulatory filings, and major financial outlets, and the full encyclopedia of historical bubbles for parallel-matching. The model is instructed to flag any indicator reading that crosses a documented historical threshold and to anchor its analysis in that signal rather than in sentiment or narrative.
Editorial independence matters. Bubblepedia does not accept sponsored placements inside analysis articles, and affiliate links — where they appear — are confined to clearly labelled blocks separated from the body copy. We do not short or hold leveraged positions in any asset discussed, and we do not publish price targets or trade recommendations. The goal is structural understanding: helping readers recognise the shape of a bubble before it bursts, and the shape of a recovery before it begins. Bookmark this page or subscribe to the weekly digest to follow the analysis as it evolves.

Who Moves Where — and Why It Matters More Than Interest Rates for Australian Property
As Australia's net overseas migration cycle peaks and begins to moderate, historical evidence from Japan, Ireland, and Sweden shows that demographic inflection points — not rate cycles — have been the decisive trigger for prolonged property busts.

Retail Crowds, YOLO Traders, and the ICO Playbook: Who Was Buying at the Peak in 2017 — and Who Is Buying Now
A momentum crash hitting retail 'YOLO' traders in mid-2026 echoes the participant composition of the 2017 ICO mania, when unsophisticated buyers flooded into unregulated token sales they barely understood — a dynamic that has repeated through every subsequent crypto cycle.

Bitcoin Miner Financial Stress in 2026: Early Warning Signals and the Capitulation Cycle
As Bitcoin miner revenue per exahash falls to multi-year lows while network hash rate remains elevated, the classic capitulation signal is forming — a pattern that has preceded every major Bitcoin cycle bottom, and whose psychological dynamics mirror the NFT bubble's final, drawn

Construction at 24% of GDP: How Ireland, Spain, and China Crashed
When residential construction swells to an outsized share of national output, history shows the unwinding is rarely gradual — Ireland, Spain, and China each demonstrate how deeply embedded building activity amplifies property busts into economy-wide crises.

Oil at $100: Sovereign Debt Crisis Since 2012
As the PBOC floods markets with its largest liquidity injection in five months and Brent crude surges past $100, the compounding pressures on sovereign balance sheets worldwide are reaching thresholds that historically precede disorderly debt adjustments.

Mt. Gox and Crypto Regulation: What Changed, What Did Not
Official records distinguish financial-crime guidance, exchange licensing and creditor repayments, showing why these are different responses to exchange failure.

Stablecoin Fractional Reserves and the Peg Illusion: Lessons from Crypto's Collateral Crisis
As stablecoins underpin trillions in crypto liquidity, the opacity of their reserve mechanics echoes historical collateral crises — and the NFT bubble's collapse offers a precise case study in what happens when confidence in backing evaporates.

Australia's Household Debt-to-Income Ratio at 186%: Where This Path Has Led Before
Australia's household debt-to-income ratio, among the highest in the developed world, follows a trajectory that preceded severe property corrections in Denmark, Canada, and the Netherlands — with rising bond yields now compressing the margin for error.

KKR's Commercial Real Estate Lender Explores Sale or Merger Amid Property Market Pressures
As KKR's commercial real estate lending arm explores a sale or merger amid rising stress, the widening gap between rental yields and bond yields is flashing the same warning signal seen before major property corrections in Japan, the US, and Australia.

Korean Retail Traders Return to High-Risk CFD Bets Despite Past Losses, as Treasury Yields Rise
South Korean retail traders are returning to high-risk leveraged bets just as U.S. Treasury yields hit two-month highs and central bank policy paths diverge sharply — a combination that historically precedes violent capital reversals in emerging markets.

Concentration Risk: When 500 Stocks Become 493
The S&P 500's top-heavy structure — where seven stocks control over 33% of the index and trade at 66x forward earnings — mirrors the Nifty Fifty concentration of the early 1970s, with passive investing mechanics amplifying the distortion in ways that era never experienced.

Credit Cycles and Property Busts: Why 2004-2008 Matters
When credit conditions tighten after a prolonged lending boom, property markets rarely correct immediately — history shows the damage accumulates quietly over 18 to 36 months before becoming visible in prices.

Money Funds Go Short, Korea Deleverages: Defensive Signals Spread Across AI-Exposed Markets
US money market funds have shortened the average maturity of their holdings as the Federal Reserve withholds clear guidance on its rate path, while South Korean traders have cut margin loans sharply from a June peak and China has mounted a broad state-backed effort to halt a tech

Baby Booms, Ghost Cities, and the Migration Trap: How Demographic Reversals Destroyed Property Values in Japan, Ireland, and Sweden
When the demographic engines powering property booms stall — through falling birth rates, migration policy shifts, or sudden population outflows — history shows that price corrections follow with a severity that interest rate policy alone cannot explain.

Iran Tensions, Oil Spikes, and the Volatility Hedge Surge: How Geopolitical Supply Shocks Transmit Into Bubble-Era Valuations
Rising demand for options hedges, record bearish bets on the New Zealand dollar, and US-Iran hostilities reigniting rate-hike expectations reveal how geopolitical supply shocks are now stress-testing equity valuations inflated during years of suppressed volatility.

When Miners Break Before Markets Bottom: Decoding Bitcoin's Capitulation Clock
Miner capitulation — when Bitcoin producers sell reserves or shut down rigs at a loss — has historically preceded major market recoveries, but the signal is more complex and less reliable than crypto bulls typically acknowledge.
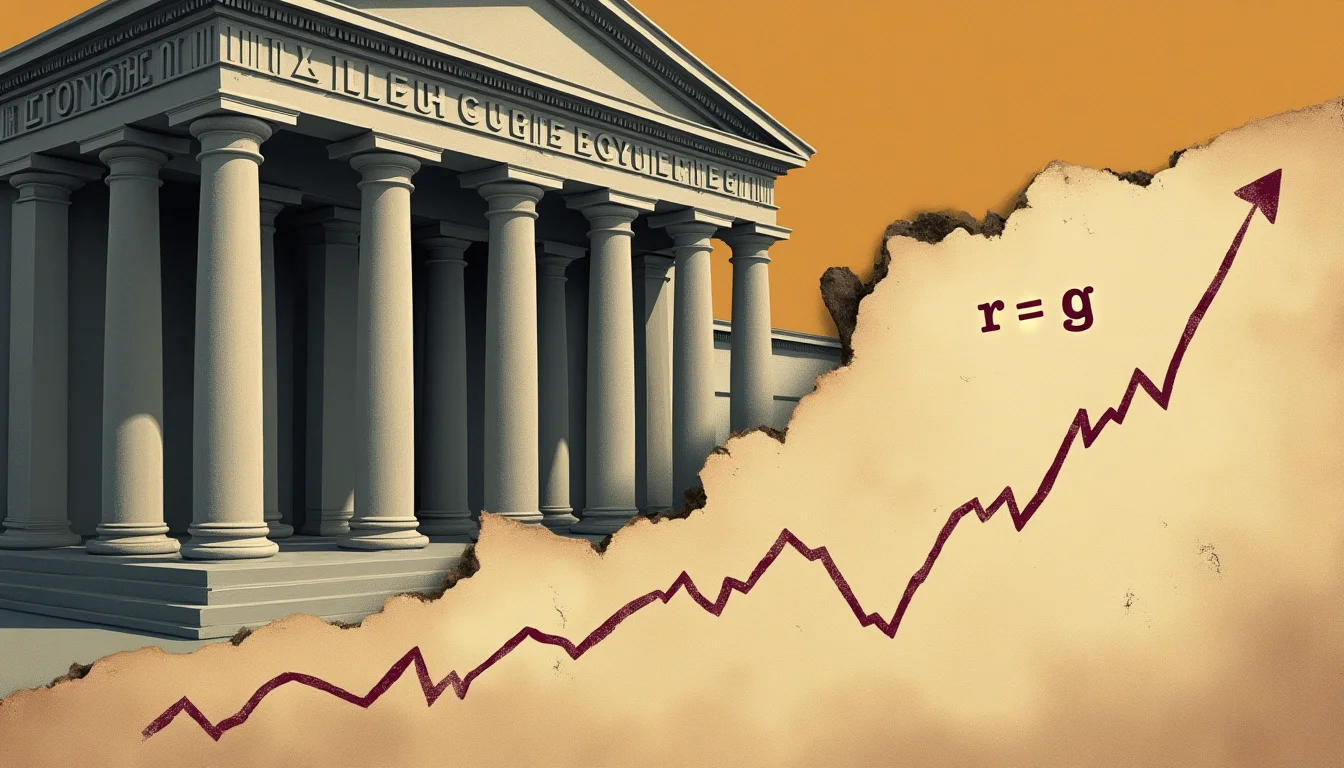
Sovereign Debt Crisis: The 2008-2021 Era Ends in 2026
With 30-year US Treasury yields holding above 5% and real yields at multi-decade highs, the structural math of sovereign debt sustainability is deteriorating in ways that echo the complacency that preceded historic market dislocations.

Asia AI Bets, Leveraged Retail Crowds, and the Political Reckoning That Follows Every Megacap Mania
Wall Street banks are posting record earnings on Asia-driven AI equity flows, but the retail traders crowding into leveraged AI funds are already being crushed — a sequence that historically triggers the regulatory aftermath every bubble eventually produces.

Stablecoin Reserves and the Redemption Illusion: What the NFT Crash Teaches About Collateral Confidence
The mechanics of stablecoin reserves — opaque, concentrated, and stress-untested at scale — share a structural kinship with the confidence-dependent valuations that collapsed the NFT market in 2022, raising serious questions about crypto's foundational liquidity layer.

Australia's 180% Debt Ratio: Denmark's 280% and Ireland's 200% Warning
Australia's household debt-to-income ratio has followed a trajectory strikingly similar to Denmark before 2008 and Ireland before 2007, but the speed of the climb and the structural absence of a meaningful deleveraging episode sets it apart from every comparable historical case.

Dollar Hedging Costs Hit 2026 Lows — and Currency Intervention Regimes Are Quietly Pricing In the Next Dislocation
Falling dollar hedging costs are masking structural stress in the currency intervention regimes that underpin overvalued equity markets, echoing the conditions that preceded past liquidity crises.

Circle's Stablecoin Squeeze and the Exchange-Concentration Trap Crypto Struggles to Escape
Intensifying competition in the stablecoin market is compressing Circle's margins just as crypto trading volume remains dangerously concentrated on a handful of venues — a structural fragility with clear precedents in crypto's own boom-bust history.

Rental Yields Below Bond Returns: Australia's 2025 Warning
Australia's gross rental yields have compressed to levels where government bonds now offer comparable or superior returns — a condition that preceded major property corrections in Japan, Sweden, Ireland, and the United States.

Fed Holds, ECB Cuts, and Asia Fractures: Central Bank Divergence Is Repricing Emerging Markets in Real Time
As the Federal Reserve and European Central Bank pursue conflicting monetary paths in mid-2026, emerging market equities are absorbing the cross-current damage — a pattern with uncomfortable echoes of the liquidity mismanagement that destroyed John Law's Mississippi Company in 17