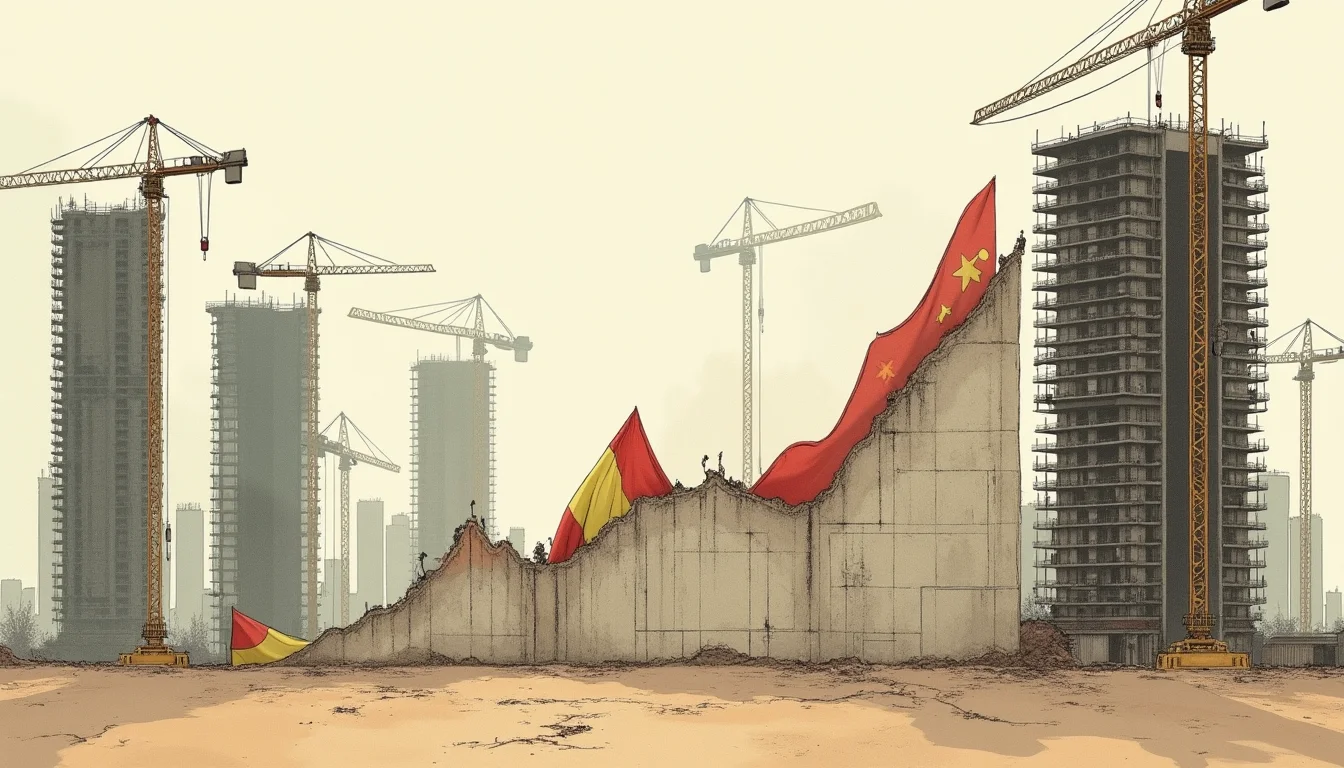
At the peak of Ireland's property boom in 2006, construction activity accounted for roughly 24 percent of GDP — a figure so far outside historical norms that it functioned less as an economic indicator than as a structural warning. According to the Bubblepedia Irish Property Bubble entry, when that sector collapsed, it dragged employment, tax revenues, and bank balance sheets down simultaneously, producing one of the most severe peacetime economic contractions in modern European history. The Irish case is not an outlier. It is a template.
The Dependency Trap
Construction is unusual among economic sectors in that it generates employment, tax receipts, and consumer confidence all at once — while also producing the asset whose price appreciation is simultaneously driving the boom. This creates a feedback loop that is self-reinforcing on the way up and self-destructive on the way down. When construction forms a large share of GDP, a correction in property prices does not merely reduce wealth on paper. It destroys jobs, collapses government revenues, and impairs the banking system's collateral base in a single, compounding motion.
Economists have long recognised that residential investment shares above roughly 6 to 8 percent of GDP represent elevated cyclical risk. The precise threshold varies by country and structural context, but the direction of the signal is consistent: the higher the share, the more violent the mean reversion. Spain's construction sector reached approximately 16 percent of GDP in 2006, according to data reviewed in the Bubblepedia Spanish Property Bubble entry. The subsequent correction erased more than half of residential construction activity within five years and left unemployment above 25 percent at its 2013 peak.
Three Case Studies in Structural Overbuilding
Ireland (2000–2008): The Irish state became fiscally dependent on stamp duties, VAT receipts from new construction, and income taxes from a swollen building workforce. When prices turned, the government faced a simultaneous collapse in revenue and an explosion in bank recapitalisation costs. The International Monetary Fund's post-crisis assessment identified construction-GDP dependency as a primary amplifier of fiscal fragility — the boom had been mistaken for structural prosperity when it was cyclical revenue dressed as permanent income.
Spain (2003–2012): Spain built more housing units annually at its peak than Germany, France, and the United Kingdom combined — despite having a fraction of their combined population. The construction sector's GDP share reflected not genuine demand but a credit-fuelled supply surge that treated future price appreciation as a business model. When European Central Bank rate normalisation began compressing affordability, the oversupply became visible almost immediately. Entire coastal developments were completed into a market with no buyers, and the banking sector — heavily exposed to developer loans — required a European Stability Mechanism bailout in 2012.
China (2010–present): China's case is the most structurally extreme. At various points over the past decade, real estate and related industries have accounted for an estimated 25 to 30 percent of Chinese GDP when upstream and downstream linkages are included — a dependency so deep that the sector has been described as the economy's central load-bearing pillar. The developer debt crisis that surfaced publicly with Evergrande in 2021 has not resolved; it has been managed through a combination of state-directed restructuring and suppressed price discovery. The Bubblepedia China Property Bubble entry documents how the unwinding of this dependency, even at a controlled pace, carries systemic implications that extend well beyond the property sector itself.
Why the Signal Is Structurally Distinct From Other Bubble Indicators
Most bubble indicators — price-to-income ratios, credit growth rates, rental yield compression — measure the price of an asset relative to some fundamental anchor. Construction-GDP dependency measures something different: the degree to which the real economy has been reorganised around the production of that asset. This distinction matters because it determines the nature of the correction. A price correction in a market where construction is a normal share of output is painful but bounded. A price correction in a market where construction has become a structural pillar of employment and tax revenue is potentially systemic.
The danger is not simply that property prices fall. It is that the economy has been restructured around the assumption that they will not — and that unwinding that restructuring takes years, not quarters.
For Australian property market context, this distinction is analytically significant. Australia's residential construction sector has historically operated within a more moderate GDP share than Ireland or Spain at their peaks, but the concentration of employment, household wealth, and banking system exposure in property-related activity has followed a directionally similar pattern. The current bubble risk indicators tracked by Bubblepedia reflect this structural dimension alongside price-level metrics.
The Political Economy of Dependency
One reason construction-GDP dependency persists until it breaks is that it creates powerful political constituencies for its continuation. Developers, construction workers, real estate agents, local governments dependent on land sale revenues, and banks with large mortgage books all have direct interests in sustaining activity. In Ireland, Spain, and China alike, regulatory and monetary signals that might have moderated the boom were delayed or diluted by these pressures. By the time the dependency became undeniable, the structural exposure was already severe.
This political economy dynamic also shapes the post-bust response. Governments that have become fiscally dependent on construction-related revenues face a simultaneous collapse in income and an increase in expenditure demands — precisely the conditions that convert a property correction into a sovereign stress event, as Ireland's 2010 bailout demonstrated.
What Distinguishes a Managed Slowdown From a Structural Break
Not every elevated construction share ends in crisis. Canada and Australia have both sustained above-average residential investment for extended periods without the abrupt dislocations seen in Ireland or Spain. The differentiating factors appear to include the quality of banking regulation, the presence or absence of oversupply relative to genuine demographic demand, and the degree to which construction activity reflects population growth rather than speculative inventory accumulation.
The comparison between Japan's 1980s property bubble and the US 2008 housing crisis is instructive here: both involved significant construction dependency, but Japan's unwinding was slow and deflationary while America's was rapid and financial. The speed of the correction varied; the structural damage to both economies was lasting in each case.
Analysts monitoring current property markets would do well to track construction's share of GDP not as a secondary indicator but as a primary one. When an economy has built its output structure around the production of an asset whose value depends on continued price appreciation, the question is not whether a correction will have real-economy consequences. It is how severe those consequences will be — and how much of the political and regulatory apparatus has been captured by the interests that depend on the boom continuing.
History, reviewed across the full Bubblepedia bubble encyclopedia, suggests the answer is rarely reassuring.
See also: Spanish Property Bubble vs Irish Property Bubble — Two European Crashes Compared.