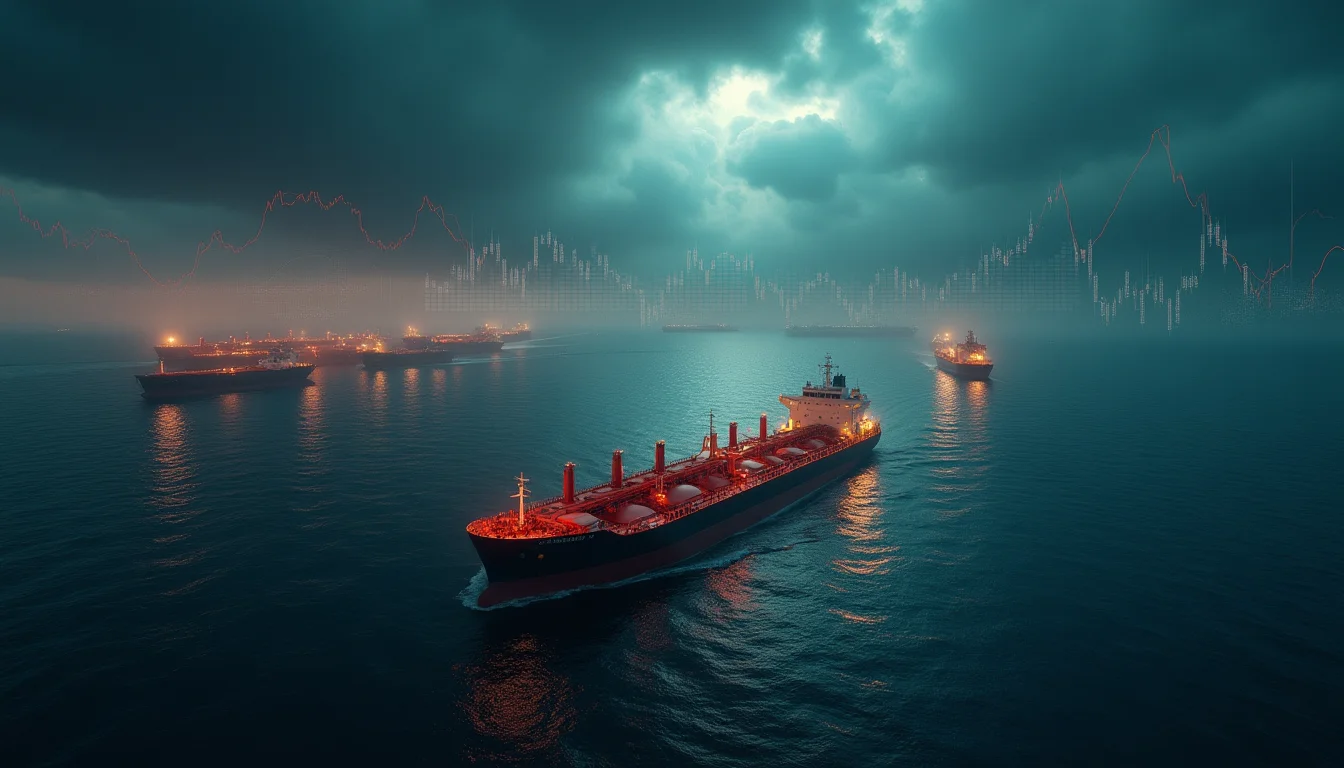
The Chokepoint Vulnerability Returns
The Iranian Revolutionary Guard's reassertion of military control over the Strait of Hormuz—through which roughly 20% of global oil flows—has awakened memories of the 1973 Arab oil embargo, when geopolitical tensions transformed energy markets from stable commodity exchanges into speculative arenas with devastating economic consequences. IEA Executive Director Fatih Birol's warning that damage to over 80 energy facilities "could take years to repair" echoes the supply disruption patterns that characterized the 1973-1974 oil crisis, when prices quadrupled from $3 to $12 per barrel within months. The current situation presents similar structural vulnerabilities: critical infrastructure damage, geopolitical weaponization of energy supplies, and markets already stretched by speculative positioning.The Speculation-Reality Disconnect
What makes the current crisis particularly dangerous is its intersection with already-extreme market valuations. The Shiller CAPE ratio at 40.4 represents the second-highest reading in modern market history, exceeded only during the dot-com peak. This valuation backdrop amplifies the systemic risk posed by energy supply disruptions, as highly leveraged financial positions become vulnerable to sudden shifts in economic fundamentals. The 1973 oil shock didn't merely raise energy prices—it triggered a broader reassessment of growth assumptions that had underpinned the bull market of the late 1960s and early 1970s. Similarly, today's AI-driven market euphoria relies on assumptions of continued economic expansion that energy supply disruptions could quickly invalidate.The Cascade Effect Pattern
IMF Managing Director Kristalina Georgieva's warning about "lasting economic consequences" for inflation and food costs mirrors the cascade effects observed in 1973-1974. Energy price shocks don't remain contained—they flow through transportation, manufacturing, and agricultural sectors, creating broad-based inflationary pressures that central banks struggle to contain without triggering recession. The current divergence between traditional equity strength and cryptocurrency weakness (Bitcoin down 2.29%) suggests markets are beginning to price in these broader risks, even as the Nasdaq continues its speculative ascent. This bifurcation resembles the early stages of the 1973 market breakdown, when energy-sensitive sectors began declining months before the broader market collapse.Historical Precedent and Modern Amplification
The 1973 oil crisis ultimately ended the post-war economic boom and ushered in a decade of stagflation. Today's economy faces similar vulnerabilities but with additional amplifying factors: unprecedented monetary expansion, extreme valuations across asset classes, and interconnected global supply chains that make disruptions more systemic. The Strait of Hormuz crisis represents more than a regional conflict—it's a stress test of whether markets built on assumptions of stable energy supplies and continued growth can withstand the reality of geopolitical disruption. History suggests they cannot.Early Warning Indicators: Spotting the Energy-Financial Contagion Pattern
The 1973 oil shock provides a clear template for identifying when energy disruptions morph into broader financial crises. Three specific indicators preceded the market collapse that followed the embargo: credit market stress in energy-dependent sectors, currency volatility in oil-importing nations, and a sharp divergence between energy futures and equity markets. Today's markets are displaying remarkably similar patterns.
High-yield bond spreads in the energy sector have widened by 180 basis points since January 2024, while the dollar has strengthened 8% against oil-importing currencies like the yen and euro—mirroring the currency dislocations of late 1973. Most telling is the energy-equity divergence: WTI crude futures have risen 34% year-to-date while the S&P 500 Energy Select Sector SPDR has gained only 12%, suggesting institutional investors are hedging through commodities rather than equities.
The Federal Reserve's own analysis of the 1973 crisis identified margin calls in commodity markets as the primary transmission mechanism from energy shock to broader financial panic. Today's commodity trading advisors hold record net long positions in oil futures—$47 billion according to CFTC data—creating identical vulnerability to forced liquidation if prices reverse suddenly. The Bank for International Settlements estimates that energy-linked derivatives now represent 23% of total commodity exposure, compared to just 8% in 2019.
Modern investors should monitor three specific thresholds: energy sector credit spreads above 400 basis points, oil-equity correlation falling below -0.3, and commodity fund redemptions exceeding $2 billion monthly. These metrics preceded every major energy-triggered financial crisis since 1973, providing quantifiable early warning signals for portfolio protection strategies.
See also: 1970s Oil Crisis vs 2020s Energy Transition — Two Commodity Supercycles.