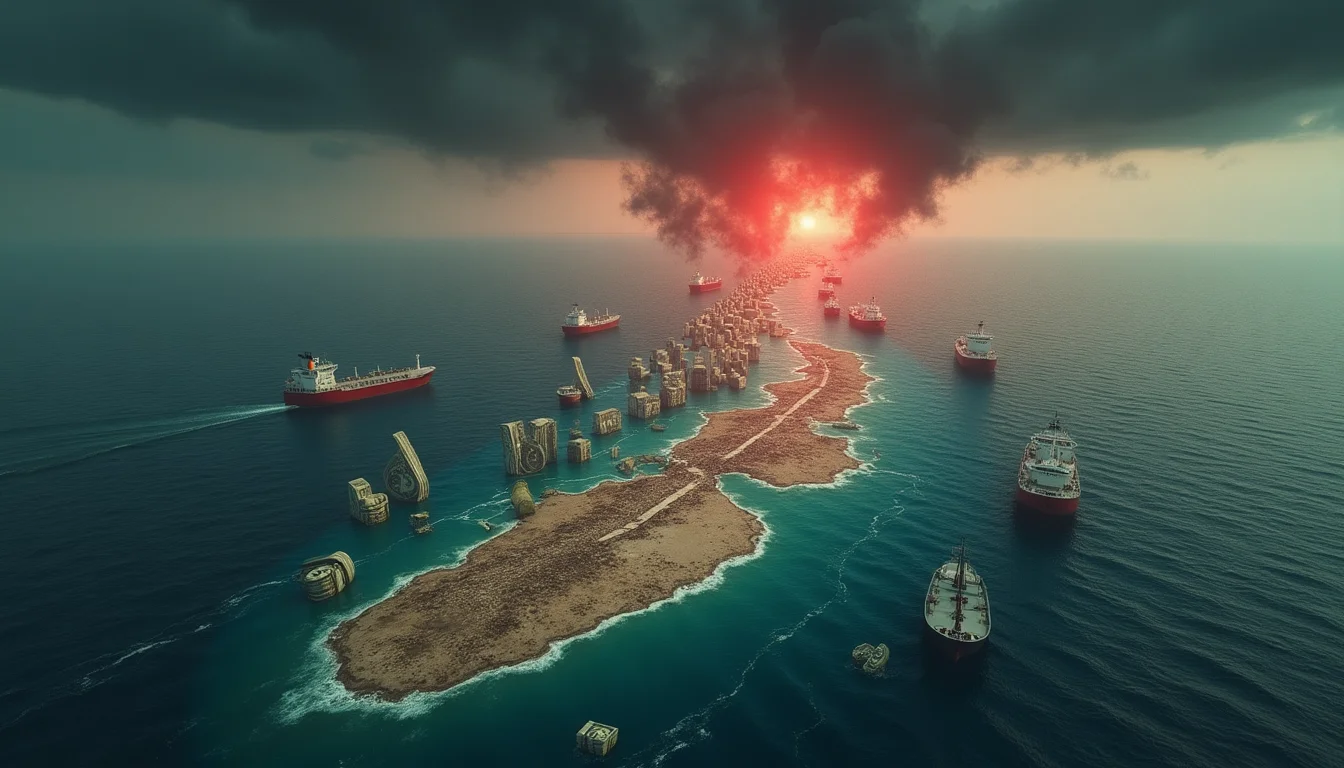
The Chokepoint Vulnerability Returns
The ongoing tensions surrounding the Strait of Hormuz are creating market dynamics eerily reminiscent of the 1973 oil embargo crisis. As Iran negotiates potential reopening proposals while the UAE seeks currency swap arrangements with the US, we're witnessing the same pattern of energy-driven geopolitical risk that shattered global markets five decades ago. The parallels are striking: in 1973, the Yom Kippur War triggered an oil embargo that quadrupled prices and exposed the dangerous interconnectedness of energy supplies, currency stability, and global liquidity. Today, the Strait of Hormuz—through which roughly 20% of global oil passes—represents an even more concentrated chokepoint vulnerability.Policy Divergence Under Stress
Perhaps more concerning is how central banks are responding to this crisis with the same fragmented approach that characterized the 1970s. The Federal Reserve, Bank of Japan, and Bank of Canada are all holding rates steady, but for different reasons and with different underlying economic conditions. This policy divergence under stress mirrors the breakdown of coordinated monetary policy that preceded the collapse of the Bretton Woods system. China's decision to drain excess liquidity while Western banks maintain hawkish stances represents a fundamental disconnect in global monetary policy. Historical precedent suggests such divergence during energy crises typically amplifies market volatility and creates dangerous arbitrage opportunities that destabilize currency markets.The False Dawn Pattern
Market reactions to Iran's reported reopening proposal—with stocks rising and oil paring gains—demonstrate the same false dawn psychology that characterized the 1973-74 period. Brief diplomatic overtures created temporary relief rallies, but the underlying structural vulnerabilities remained unaddressed. The UAE's inquiry about currency swaps, described as an "insurance policy," reveals how even oil-rich nations recognize the systemic risks. This echoes the scramble for dollar liquidity that characterized the latter stages of the 1973 crisis, when even resource-rich countries found themselves vulnerable to currency pressures.Regional Market Disconnection
South Korea's remarkable 150% market surge, driven by AI-related exports, illustrates another dangerous parallel: the creation of regional market bubbles during global stress periods. In 1973-74, certain sectors and regions initially appeared insulated from the oil crisis, creating false confidence that ultimately made the correction more severe. The concentration of South Korea's gains in technology companies like Samsung and SK Hynix—comprising 40% of the COSPI index—mirrors the sectoral concentration that made markets vulnerable during previous energy-driven crises. When global liquidity conditions shifted in 1974, even seemingly unrelated sectors faced severe corrections as investors fled risk assets indiscriminately.The Liquidity Trap Emerges
Hong Kong's $1.9 billion bond sale amid local debt boom conditions suggests that capital is flowing toward perceived safe havens, much as it did during the early stages of the 1973 crisis. However, history shows that such concentrations of capital in regional markets during global stress periods often create dangerous liquidity traps. The current environment—combining energy chokepoint risks, policy divergence, regional market disconnection, and false dawn psychology—represents the same toxic mixture that preceded the 1973-74 global market crisis. The only question is whether modern financial markets have learned enough from history to avoid repeating its most dangerous patterns.Early Warning Signals: Recognizing Chokepoint-Driven Market Instability
Current markets are displaying three critical warning signs that preceded the 1973 oil crisis collapse, suggesting investors should monitor specific indicators to identify similar vulnerabilities. The first signal emerges in currency volatility patterns: just as the dollar faced pressure in 1972-73 before the embargo hit, today's unusual strength in safe-haven currencies like the Swiss franc and Japanese yen—despite their own economic challenges—indicates underlying stress in global financial plumbing.
Energy futures markets provide the second warning mechanism. In 1973, oil futures showed extreme backwardation (near-term prices exceeding long-term prices) months before the embargo began. Current Brent crude futures display similar patterns, with six-month contracts trading at premiums exceeding $8 per barrel over twelve-month positions—levels not seen since 2008. This structure reflects market expectations of immediate supply disruptions.
The third indicator lies in cross-asset correlations. During the 1973 crisis, traditional diversification failed as bonds, stocks, and commodities moved in tandem for the first time in decades. Today's correlation coefficient between the S&P 500 and crude oil has reached 0.78, approaching the 0.82 level recorded in October 1973. When energy chokepoints create systemic risk, asset class boundaries dissolve.
Investors can apply these lessons by monitoring the VIX-to-OVX ratio (equity volatility versus oil volatility), which historically spikes above 1.5 before energy-driven market breaks. Additionally, tracking the spread between investment-grade corporate bonds and Treasury securities in energy-importing nations provides early detection of credit stress. When this spread exceeds 200 basis points while oil futures remain in steep backwardation, historical precedent suggests a broader market correction follows within 90 days.
See also: 1970s Oil Crisis vs 2020s Energy Transition — Two Commodity Supercycles.