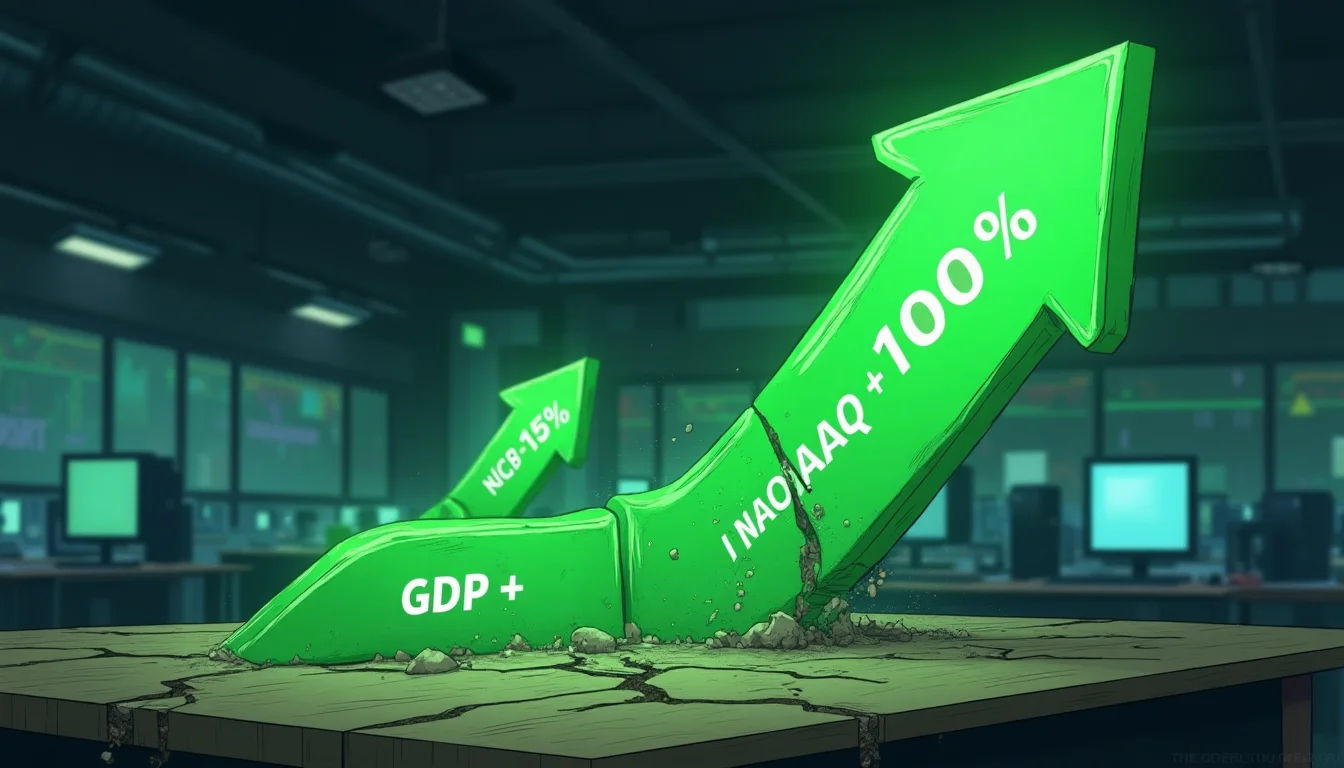
The Divergence Accelerates
The Nasdaq Composite has surged 100% over the past three years while the underlying economy expanded by merely 15% in nominal terms—a valuation-to-fundamentals ratio of nearly 7:1 that echoes the most dangerous periods in market history. This disconnect, now entering its fourth year, mirrors the euphoric phase of the dot-com bubble when technology stocks became completely untethered from economic reality.
Historical Parallel: The 2000 Dot-Com Peak
Between 1995 and 2000, the Nasdaq gained 400% while U.S. GDP grew approximately 35% in nominal terms—a ratio of roughly 11:1 at the peak. The current 7:1 ratio suggests we may be in the middle stages of a similar bubble formation. Like the late 1990s, today's rally is driven by transformative technology narratives (AI replacing the internet) and widespread retail participation through passive indexing.
The Federal Reserve's policy response adds another parallel. Just as Alan Greenspan's "irrational exuberance" comments in 1996 failed to curb speculation, current monetary policy remains accommodative despite clear signs of asset price inflation. The appointment of Kevin Warsh as Fed Chair nominee, scheduled for confirmation hearings next week, introduces additional uncertainty into an already fragile system.
The Geopolitical Wild Card
Former Treasury Secretary Hank Paulson's warning about "global shocks spilling into US markets" from the Iran conflict adds a dangerous variable absent during the dot-com era. The 2000-2002 crash occurred during relative geopolitical stability; today's bubble faces potential external shocks that could accelerate any correction.
The Strait of Hormuz reopening has temporarily calmed energy markets, but oil tankers "racing through" the strait suggests underlying supply chain fragility. This geopolitical overlay creates conditions for a sharper, more sudden correction than the relatively orderly dot-com deflation.
Corporate Behavior Signals Peak Speculation
Executive actions increasingly mirror late-stage bubble behavior. Blue Owl Capital's co-CEOs removing company shares as collateral for personal loans signals management's lack of confidence in their own stock prices—reminiscent of insider selling patterns before the 2000 crash. Similarly, biotech companies rushing to IPO amid "robust investor demand" echoes the IPO frenzy of 1999-2000.
The market's response to Fermi's CEO departure—a 31% post-market plunge—demonstrates the fragility underlying current valuations. Such violent reactions to routine corporate changes suggest investors are pricing in perfection while remaining hypersensitive to any disruption.
The Inevitable Reckoning
History suggests that valuation-fundamentals disconnects of this magnitude are ultimately unsustainable. The dot-com crash erased 78% of the Nasdaq's value over 31 months. While timing remains unpredictable, the mathematical relationship between asset prices and underlying economic output suggests significant downside risk as this cycle matures.
Corporate Earnings Reality Check: When Valuations Outpace Profit Growth
The most telling warning sign lies in the divergence between stock prices and actual corporate earnings growth. S&P 500 companies reported aggregate earnings growth of just 8.2% in 2023, while the index itself gained 24.2%—a clear indication that multiple expansion, not fundamental improvement, drove returns. This pattern directly parallels 1999, when earnings grew 12% while the S&P 500 surged 19.5%, pushing the price-to-earnings ratio to 29.4 by March 2000.
Technology sector fundamentals reveal even starker disconnects. The "Magnificent Seven" stocks trade at an average forward P/E of 28.3, compared to their historical average of 19.1. Microsoft's current valuation implies the company must grow earnings at 15% annually for the next decade—a feat achieved by fewer than 3% of large-cap companies historically. Apple trades at 25 times forward earnings despite iPhone sales declining 2.4% year-over-year in Q3 2024.
The revenue quality deterioration mirrors dot-com era patterns. Many AI-focused companies report revenue growth driven by one-time implementation contracts rather than recurring subscription models. NVIDIA's data center revenue, while impressive at $47.5 billion annually, faces inevitable cyclical pressures as enterprise AI spending normalizes. This echoes how Cisco's networking equipment sales peaked in Q1 2000 before plummeting 88% over the following two years.
Margin compression provides the final warning signal. Aggregate corporate profit margins peaked at 12.8% in Q2 2023 and have declined to 11.9% as labor costs rise and pricing power erodes. Similar margin pressure preceded the 2000 collapse, when corporate margins fell from 10.1% to 7.2% between 1999 and 2001, amplifying the earnings decline that ultimately justified lower stock valuations.