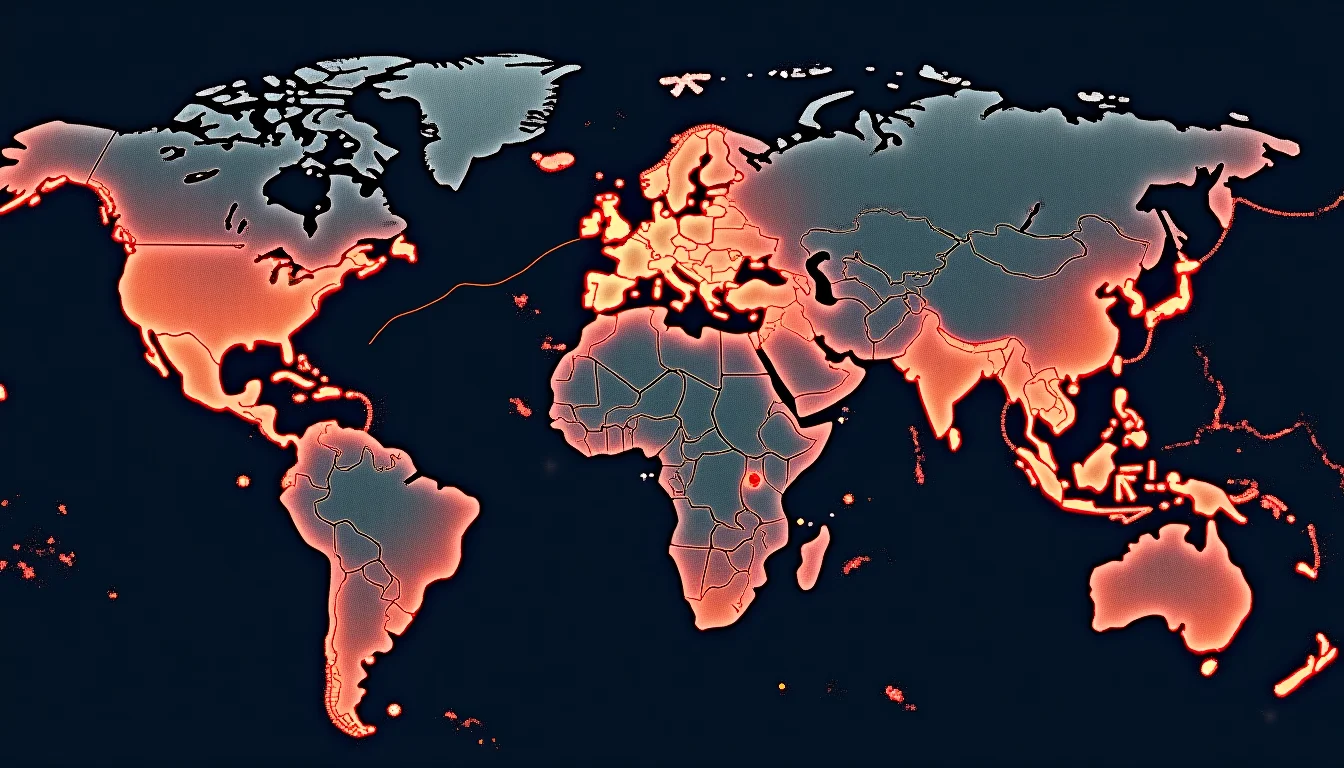
This is not a novel mechanism. The oil shocks of 1973 and 1979 each triggered cascading repricing across global capital markets. What is distinctive about the current episode is the degree to which financial markets entered this supply shock in a condition of extreme valuation. When geopolitical disruption arrives into a market priced for perfection, the repricing is not linear — it is discontinuous.
Emerging Markets as the First Fracture Point
The fracture lines are already visible. Bloomberg's coverage of Indian bond markets on 15 September shows Indian sovereign debt declining under a combination of the Reserve Bank of India's debt-sale plan and the global selloff — a compound pressure that illustrates how domestic policy decisions and external shocks interact destructively when global liquidity is tightening. India is not an isolated case; it is the most visible node in a broader emerging-market stress pattern driven by dollar strength, rising US yields, and energy import costs.
"When long-duration yields rise faster than earnings revisions can absorb, the repricing is not a correction — it is a revaluation of the entire risk premium structure."
— Current equity valuation context, as tracked by equity valuation and market risk indicators
The mechanism was identical to what is unfolding now. Geopolitical supply shocks raised energy costs and inflation expectations. The Federal Reserve, which had been tightening aggressively through 1999 and 2000, found itself caught between inflation pressure and a deteriorating growth outlook. Long-duration Treasury yields rose, compressing the equity risk premium for technology stocks that had no current earnings to fall back on. The repricing, when it came, was not orderly.
Today's technology and AI infrastructure sector presents a structurally similar vulnerability. As WealthWatchPro has documented, calls for an AI development slowdown are placing technology dividend stocks under fresh scrutiny — a signal that the growth premium embedded in technology valuations is beginning to face the same kind of earnings-reality test that exposed dot-com valuations in 2000. For a direct comparison of these structural similarities, see Dot-Com Bubble vs. AI Infrastructure 2024.
Investors and analysts monitoring these dynamics can track evolving risk signals through Bubblepedia's current bubble risk indicators and the broader bubble encyclopedia, which contextualises today's conditions against the full historical record of speculative excess and systemic collapse.
Why It Matters for Portfolio Risk
The practical implication of multi-channel geopolitical transmission is that diversification strategies built on historical correlation assumptions may fail precisely when they are most needed. In 2000–2002, investors discovered that technology equities and investment-grade bonds did not behave as uncorrelated assets when a geopolitical shock simultaneously raised inflation expectations and destroyed growth forecasts. The same dynamic is visible in September 2026: gold, which should benefit from geopolitical risk, is instead being suppressed by rate-hike expectations driven by the same geopolitical shock that is pushing investors toward it. When traditional hedges stop working in their expected direction, it is a reliable signal that the market is repricing systemic risk rather than idiosyncratic risk.
The historical record, from the Bubblepedia timeline of major financial crises, suggests that these moments of hedge-failure are not random. They cluster around the transition from late-cycle complacency to early-crisis recognition — the precise inflection point that is extraordinarily difficult to identify in real time, and extraordinarily costly to misread.