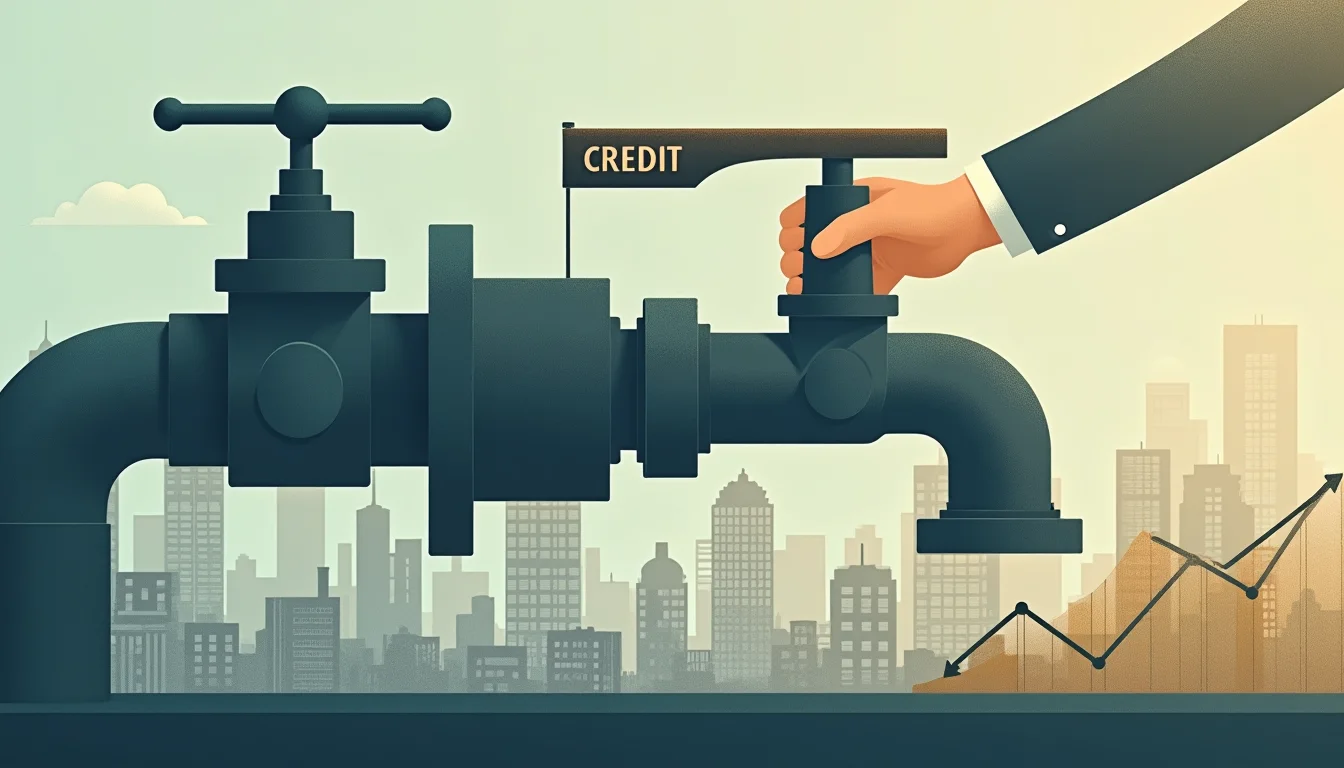
Credit availability does not collapse overnight. It retreats in stages — a serviceability buffer raised here, a maximum loan-to-value ratio trimmed there, a bank's internal credit committee quietly tightening its appetite for high-debt-to-income loans. By the time the tightening is visible in transaction volumes and auction clearance rates, the machinery has usually been running for twelve to eighteen months. This lag between credit turn and price turn is one of the most consistent — and most consistently underappreciated — features of property bubble cycles across the past century.
According to the Bubblepedia Japanese Asset Price Bubble entry, the Bank of Japan's Ministry of Finance issued its landmark "total volume control" directive on real estate lending in March 1990, capping the growth of property loans to below the growth rate of total lending. Land prices in major Japanese cities did not peak until late 1991 — a full eighteen months after the credit valve was turned. Buyers who interpreted stable prices in 1990 as confirmation that the bubble was intact were reading a lagging signal. The credit turn had already happened; the price turn was simply pending.
The Architecture of a Credit Turn
Credit availability in property markets is not a single lever. It is better understood as a composite of at least four distinct mechanisms, each of which can tighten independently or in sequence.
The first is the loan-to-value ratio (LVR). When lenders reduce the maximum proportion of a property's value they will fund — say, from 90 percent to 80 percent — the required deposit for a given purchase price rises sharply. For a median-priced dwelling, a 10-percentage-point LVR reduction can increase the required upfront capital by tens of thousands of dollars, effectively pricing out a cohort of marginal buyers who were already stretching.
The second is the debt serviceability test. Australian regulators, through the Australian Prudential Regulation Authority (APRA), require authorised deposit-taking institutions to assess whether borrowers could service their loans at a rate meaningfully above the contracted rate. This buffer has been adjusted multiple times in recent cycles. When APRA raised the serviceability buffer from 2.5 to 3.0 percentage points in October 2021, the effective borrowing capacity of a median Australian household fell by approximately 5 percent almost immediately — before the Reserve Bank of Australia had moved the cash rate by a single basis point.
The third mechanism is debt-to-income (DTI) limits. Regulators in Ireland, Canada, New Zealand, and the United Kingdom have all introduced formal DTI caps in the aftermath of their own property excesses. Ireland's Central Bank, implementing its macroprudential framework from 2015 onward, capped most owner-occupier mortgages at 3.5 times gross income. The Irish property market, which had collapsed by roughly 50 percent from its 2007 peak according to the Bubblepedia Irish Property Bubble entry, was explicitly being rebuilt with structural credit guardrails. The caps did not prevent price appreciation, but they changed its character — limiting the debt amplification that had made the 2007 collapse so severe.
The fourth mechanism is the most opaque: internal bank credit culture. Loan officers do not approve or decline applications purely by formula. When a bank's risk committee grows cautious — whether because of rising arrears in a specific postcode, regulatory guidance, or wholesale funding cost pressures — approvals slow even for borrowers who technically qualify. This informal tightening rarely appears in published data until it shows up in credit growth statistics with a two-quarter lag.
Sweden 1990, Ireland 2007, and the Geometry of the Turn
The Swedish banking crisis of the early 1990s offers a particularly instructive case study in the geometry of credit turns. Swedish banks had expanded real estate lending aggressively following financial deregulation in 1985. When the Riksbank tightened monetary policy sharply in 1990 to defend the krona's peg to the ECU, the combined effect of higher rates and tightening bank standards produced a credit contraction that was both sudden and self-reinforcing. Property prices in Stockholm fell by approximately 25 percent in real terms between 1990 and 1993, and the banking sector required government recapitalisation. Critically, the credit turn preceded the price turn — but only analysts watching loan approval data and interbank funding spreads would have seen it coming.
Ireland's 2007 episode followed a different path to the same destination. Irish credit did not tighten because regulators acted — the Financial Regulator's interventions were significantly late and modest. Instead, the credit turn was imposed externally, as Irish banks' reliance on wholesale funding from European interbank markets became untenable when those markets froze in late 2007 and 2008. The transmission from funding stress to credit contraction to price collapse was faster and more violent than the Japanese episode, precisely because the tightening was externally imposed rather than domestically managed. For a comparative view of how these property cycles differ structurally, the Bubblepedia comparison of the Japanese property bubble and the US housing crisis maps the key divergences in credit mechanism and policy response.
What Credit Indicators Actually Predict
Academic literature on property cycles — including work from the Bank for International Settlements and the International Monetary Fund — consistently identifies credit growth as a more reliable leading indicator of property stress than price-to-income ratios or rental yields. The reason is mechanical: prices are the outcome of a clearing process between buyers and sellers, and buyers' capacity is almost entirely a function of available credit. When credit availability falls, the pool of qualified buyers shrinks, transaction volumes decline, and vendors who need to sell — rather than those who can wait — set the marginal price.
For readers tracking Australian property market conditions, the relevant indicators to watch are not the headline dwelling price indices but the monthly credit aggregates published by the Reserve Bank of Australia, APRA's quarterly authorised deposit-taking institution statistics, and the proportion of new lending at high debt-to-income multiples — data that APRA has published in its residential mortgage lending statistics since 2019.
When those aggregates begin to decelerate — particularly when high-DTI lending as a share of new approvals falls — the credit turn is already in motion. The price turn, as Japan in 1990, Sweden in 1991, and Ireland in 2008 all demonstrated, is simply a matter of time and lag.
Why the Lag Creates Dangerous Complacency
The eighteen-month lag between credit turn and price turn is not a feature of the data that makes investors safer. It is the source of the most dangerous phase of any property bubble cycle: the period when prices remain elevated or even continue rising modestly, lending has already tightened, and participants interpret stable prices as evidence that the tightening does not matter.
This complacency phase is visible in the historical record with remarkable consistency. In Japan, 1990 was a year of continued optimism in property commentary even as the credit mechanism had already been constrained. In Ireland, early 2008 saw property analysts debating whether a "soft landing" was achievable even as bank funding markets had already closed. The Bubblepedia bubble risk indicators track credit growth deceleration as one of the primary early-warning signals precisely because price data, by the time it turns negative, is already confirming what credit data had signalled a year earlier.
The machinery that ends property booms is quiet, technical, and bureaucratic. It does not announce itself. It operates through serviceability buffers, LVR adjustments, funding cost pressures, and the gradual cultural shift inside bank credit committees. By the time it is loud enough to hear, the work is already done.
See also: Australian Property Bubble vs US Housing Bubble 2008 — Why One Crashed and One Did Not.