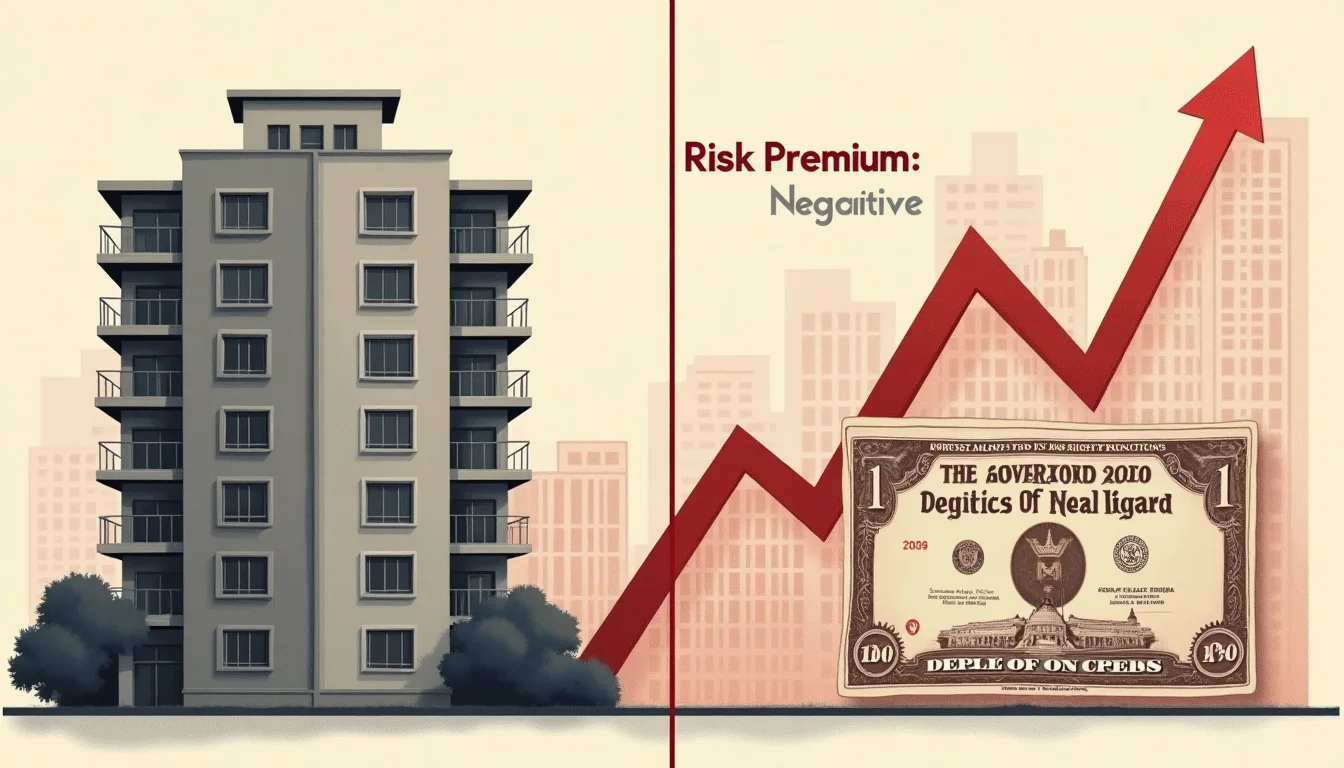
Australia's gross residential rental yields in capital cities have compressed to levels that, in several submarkets, sit at or below the prevailing yield on 10-year Australian Government Securities. That single observation — unremarkable in isolation, devastating in historical context — is one of the most consistent precursors to a property market correction that financial history records.
When the income return on a leveraged, illiquid, maintenance-intensive asset falls below the return available on a risk-free government bond, the asset is no longer priced on fundamentals. It is priced on the expectation of perpetual capital gain — the defining condition of a speculative bubble.
What the Yield Gap Actually Measures
The rental yield–bond yield gap is not merely an academic curiosity. It is a direct measure of whether residential property is offering investors adequate compensation for the risks they are accepting: illiquidity, vacancy, maintenance, leverage, and the possibility of capital loss. A property yielding 3% gross — before rates, insurance, management fees, and repairs that typically consume 1.5 to 2 percentage points — is delivering a net income return of roughly 1% to 1.5% on the purchase price.
When 10-year Australian Government bonds yield approximately 4.3% to 4.5% — as they have across much of 2025 and into 2026 — the implied risk premium for owning residential property over holding sovereign debt has turned sharply negative. An investor accepting a net 1.2% yield on a Sydney apartment while a government bond offers 4.4% is, in effect, paying a substantial premium for the privilege of taking on leverage, illiquidity, and concentration risk. The only rational justification is an expectation of capital appreciation sufficient to compensate for that yield deficit.
That expectation is not irrational in isolation. It becomes dangerous when it is universal, when it is priced in, and when the conditions that sustained it — low interest rates, strong migration, constrained supply — begin to shift. For Australian property, all three of those conditions have shifted materially since 2022.
Japan 1989 and Sweden 1992: The Yield Gap as a Leading Indicator
The historical record on negative rental-to-bond yield gaps is sobering. According to the Bubblepedia Japanese Asset Price Bubble entry, Japanese residential and commercial property yields in Tokyo compressed to levels well below Japanese Government Bond yields through the late 1980s. By 1989, prime Tokyo office yields had fallen to approximately 3%, while JGB yields sat near 6% — a gap of roughly 300 basis points in favour of bonds. Property prices peaked in late 1989 and subsequently fell for more than a decade, with Tokyo residential values declining by more than 60% from peak to trough over the following 15 years.
Sweden's property correction of the early 1990s followed a structurally identical pattern. Swedish residential yields compressed sharply during the deregulation-fuelled credit boom of the late 1980s, falling below government bond yields at precisely the moment that credit conditions began tightening. When the yield gap closed — not through rising rents but through falling prices — Swedish residential property lost approximately 30% in real terms between 1990 and 1995, and the banking system required a government recapitalisation. For a direct comparison of how yield compression precedes major corrections, the Japanese and US 2008 experiences share this structural fingerprint.
The US experience ahead of 2006 to 2008 added a further dimension. Gross rental yields in bubble markets — Phoenix, Las Vegas, Miami — fell to 4% and below while 10-year Treasury yields remained above 4.5%. The yield gap was a measurable, observable signal. It was not acted upon at the systemic level until the correction was already underway.
Why Investors Accept Negative Risk Premiums
The behavioural explanation for why rational actors continue buying assets with negative real yield spreads is well-documented in bubble literature. Three mechanisms dominate.
First, recency bias. When an asset class has delivered consistent capital gains for a decade or more — as Australian residential property has across most major cities since the early 2000s — investors extrapolate that trend and treat it as a structural feature rather than a cyclical one. The income return becomes secondary to the anticipated capital return.
Second, the absence of a credible alternative. In a low-rate environment, even a modest property yield looks attractive relative to cash or short-duration bonds. As rates rise and that comparison reverses, the reassessment can be sudden. The shift from a 10-year bond yield of 1.5% (as seen in 2021) to 4.4% (as seen in 2025–2026) fundamentally reprices the opportunity cost of holding property — but that repricing takes time to flow through a market where transactions are infrequent and prices are sticky downward.
Third, the tax and leverage structure of residential property investment in Australia specifically — negative gearing provisions and the capital gains tax discount — has historically allowed investors to tolerate yield deficits because the tax system partially subsidised them. That subsidy does not disappear when bond yields rise, but it does become less decisive when the yield gap widens to 300 basis points or more.
For broader Australian property market context, including current yield data by city and suburb, the structural dynamics of negative gearing and investor composition are central to understanding why this yield gap has persisted longer than comparable international episodes might suggest.
The Mechanism of Correction
Yield gaps do not close themselves instantly. The historical pattern suggests two distinct correction pathways: a slow-burn compression where rents rise faster than prices for several years, gradually restoring yield adequacy without nominal price falls; or an abrupt repricing where prices fall to restore yield parity when the expectation of capital gain is withdrawn.
The slow-burn pathway requires sustained rental growth — which in turn requires sustained demand exceeding supply. When migration moderates, when household formation slows, or when new supply reaches the market, the rental growth assumption weakens. The abrupt repricing pathway is typically triggered by a credit event: tightening lending standards, rising mortgage rates, or a loss of confidence among leveraged investors who can no longer service debt from rental income alone.
Australia's current position — with mortgage rates materially above the rental yields on recently purchased investment properties in most capital city markets — means that a significant proportion of investment properties are negatively geared not by design but by necessity. That is a structurally fragile condition. It requires either capital growth to justify holding costs, or a willingness to absorb ongoing cash losses indefinitely. History suggests neither condition persists.
What the Indicator Does Not Tell You
Intellectual honesty requires acknowledging what the rental yield–bond yield gap cannot predict: timing. Japan's yield gap was observable for several years before the 1989 peak. US yield compression was visible from 2004 but prices did not peak until 2006. The gap is a condition indicator, not a timing tool. Markets can remain mispriced on this measure for extended periods, particularly when credit remains available and sentiment is positive.
The indicator also does not account for structural supply constraints that may genuinely justify lower yields in high-demand cities — though the historical record suggests that supply constraints are almost always overstated at the peak of a cycle and understated in the trough. Current Bubblepedia bubble risk indicators track this yield gap alongside credit availability, construction activity, and household debt metrics to provide a composite view of where the Australian property market sits in the cycle.
What the yield gap does tell you, with considerable historical consistency, is that when property stops paying more than government bonds, the asset is no longer being held for income. It is being held for hope. And hope, as every bubble historian knows, is not a risk premium.