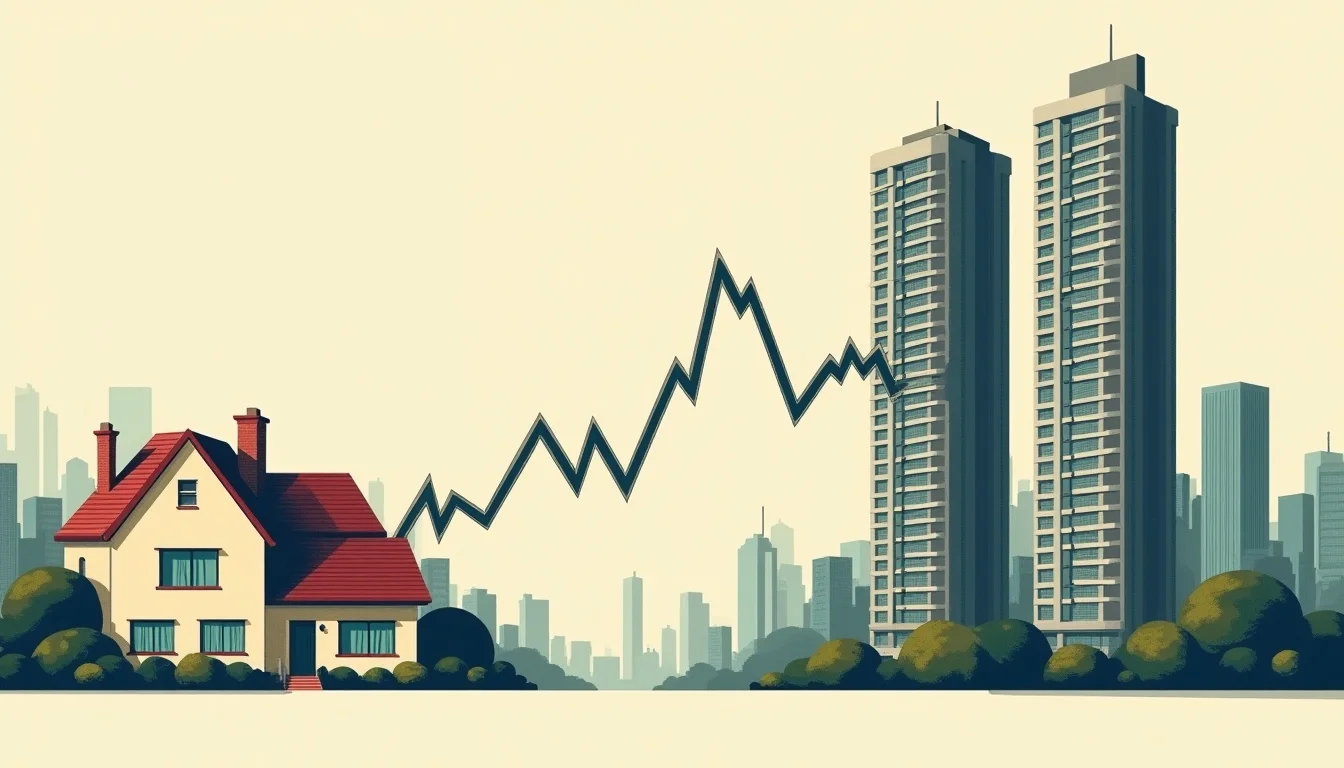
Two Markets, One Credit Signal
According to Bloomberg, Australian home prices are falling as the Reserve Bank's elevated cash rate squeezes borrowing capacity, with Sydney and Melbourne leading the retreat. Separately, according to Bloomberg, Beijing's latest stimulus measures are still struggling to revive a sector that has been starved of credit since regulators imposed the 'three red lines' financing limits on developers in 2020-21. These are separate economies at different stages of the same cycle, but both illustrate a pattern that recurs across property bubbles: the moment credit availability turns is the moment prices stop being supported by anything other than existing sentiment.
The Mechanics of a Credit-Availability Turn
Property bubbles are rarely ended by a single shock. They end when the marginal buyer can no longer borrow enough to pay the marginal seller's asking price. In China, that turn arrived through deliberate regulatory action — the three red lines policy restricted developer leverage ratios and triggered the Evergrande default in 2021, a collapse whose aftershocks are still visible in the sector five years later. In Australia, the turn is being driven by monetary policy rather than regulation: a restrictive cash rate has mechanically reduced the maximum loan size an average household can service, even where serviceability buffers and income have not changed.
According to Australian Property Forum, builders are warning that the current rate environment is now constraining new housing supply, not just resale prices — a secondary effect that compounds the credit squeeze by removing future inventory from a market that was already supply-constrained. Separately, Cotality data reported by Australian Property Forum shows Sydney prices have already fallen roughly $26,000 over the past year, with Melbourne down more. These are not catastrophic declines in isolation, but they are the kind of initial cracks that typically precede larger adjustments once refinancing cycles force more owners to test the market at prevailing rates rather than the rates at which they originally borrowed.
Why Credit Turns Are the Real Bubble Trigger
The historical record is consistent on this point: property bubbles inflate on the assumption of indefinite credit expansion and deflate once that assumption breaks. The United States housing bubble is the clearest modern case. Between 2001 and 2006, mortgage origination standards loosened steadily — stated-income loans, teaser rates, and rising loan-to-value ratios all expanded the pool of eligible buyers and pushed prices higher. When lenders abruptly reversed underwriting standards in 2007, the buyer pool collapsed just as quickly as it had expanded, and prices fell nationally for the first time since the Great Depression. The US housing bubble of 2008 is the textbook case because the turn was so visible in the data: mortgage approval rates, loan-to-value ratios, and securitization volumes all reversed sharply in the same 12-to-18 month window that prices peaked.
China's developer financing crackdown follows the same structural logic with a different mechanism — restricting credit to the supply side (developers) rather than the demand side (mortgage borrowers), but producing the same result: a market that was built on continuous leverage expansion discovers it cannot function once that leverage is withdrawn. Evergrande's default was not caused by a sudden lack of demand for apartments; it was caused by a sudden inability to roll over debt that had financed years of pre-sold, unfinished construction.
What Makes Australia's Case Distinct — and Why That May Not Matter
Australia's banking system is far better capitalized than China's shadow-financed developer sector, and its mortgage books are dominated by full-recourse lending with historically low arrears. These are genuine differences, and they argue against an Evergrande-style cascading default. But the credit-availability mechanism does not require defaults to compress prices — it only requires marginal buyers to be priced out and existing owners to face less favorable refinancing terms. A household debt-to-income ratio that has climbed for decades leaves little room to absorb a sustained rate environment without price adjustment, regardless of how well-capitalized the lenders are. Readers tracking the broader macro backdrop against which these credit cycles are unfolding can find further Australian property market context on lending conditions and regional price dispersion.
The signal to watch is not whether prices are falling in any given month, but whether lenders are tightening standards faster than borrowers are adjusting expectations — that gap, historically, is where bubbles find their floor or their trapdoor.
The Historical Parallel in Full
The comparison between Japan's 1989-90 credit tightening and the US housing collapse of 2008 remains instructive precisely because both episodes show credit-availability turns arriving through different channels — central bank rate hikes in Japan's case, underwriting collapse in America's — yet producing remarkably similar multi-year price declines once the turn was confirmed. China in 2026 and Australia in 2026 appear to be running a live version of that same divergence: one driven by direct regulatory credit restriction, the other by the blunter instrument of a restrictive cash rate. Neither path guarantees a crash on the scale of 2008 or Japan's lost decades, but both confirm that the credit-availability turn, once underway, rarely reverses quickly enough to rescue the prices that were set during the expansion phase. Readers can track live risk signals across markets on Bubble Watch or review the full catalogue of historical episodes on the Bubblepedia bubble encyclopedia.
See also: Australian Property Bubble vs US Housing Bubble 2008 — Why One Crashed and One Did Not.