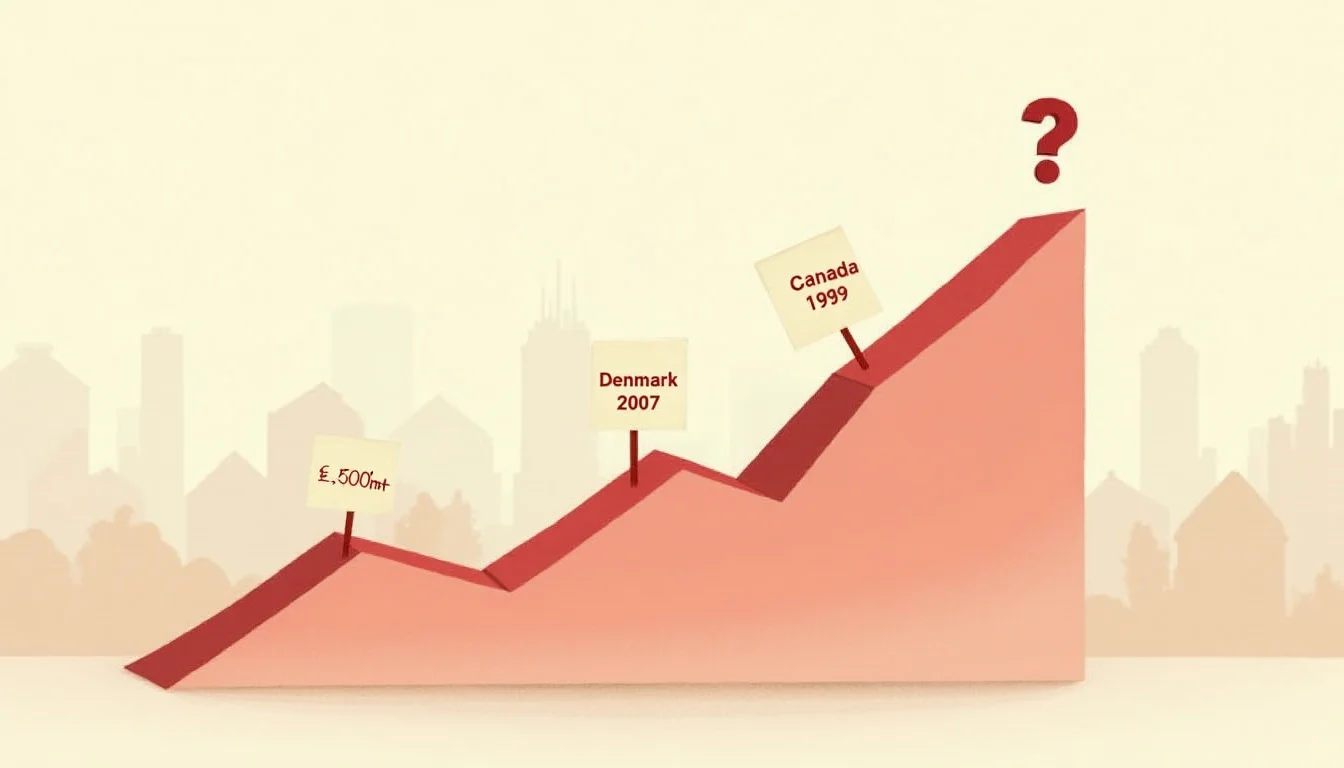
Australia's household debt-to-income ratio currently sits at an elevated level, according to data cited in the Bubblepedia Australian Property Bubble entry. That figure alone is arresting. But the more instructive question — the one that distinguishes a sustainable debt load from a pre-crash accumulation — is not where the ratio stands today, but how fast it got there, and what happened in comparable economies once the path stalled.
In every major property crash of the past four decades, the debt-to-income ratio did not simply peak and decline. It accelerated, plateaued, and then collapsed — and the collapse in debt growth preceded the collapse in prices by months, not years.
What the Path Reveals That the Level Does Not
Economists and central bankers frequently debate whether a given debt-to-income ratio is "too high." That framing misses the point. Japan's household debt-to-income ratio peaked at a substantially lower level than Australia's current ratio in the late 1980s — yet the property crash that followed the 1989–1991 unwinding was among the most severe in modern history, with urban land prices in Tokyo falling sharply from peak to trough over the subsequent decade. The ratio itself did not predict the crash; the abrupt deceleration in credit growth did.
Denmark's experience in 2007 is more directly comparable in structural terms. Danish households had accumulated debt-to-income ratios that were among the highest in the developed world at the time — driven by flexible mortgage products, interest-only lending, and a decade of double-digit annual price growth. When the European credit cycle turned in 2007–2008, Danish property prices fell significantly nationally and more sharply in Copenhagen within two years. The critical signal, visible in retrospect, was not the absolute ratio but the point at which new credit issuance began compressing even as headline prices remained elevated.
Canada offers a more recent and geographically proximate case study. By 2017, Canadian household debt-to-income had reached a high level, concentrated in Toronto and Vancouver. The Bank of Canada and OSFI (the Office of the Superintendent of Financial Institutions) introduced macroprudential tightening — stress-testing mortgage applicants at rates meaningfully above contract rates — and the Toronto market corrected materially within roughly 18 months. Prices subsequently recovered, but the episode demonstrated that policy intervention targeting the path of debt accumulation, rather than its level, can produce sharp corrections even without a recession.
The Mechanics of Debt Accumulation in Australia
Australia's debt path has been shaped by a specific set of structural conditions: persistent undersupply of housing in major cities, tax incentives that favour property investment over productive capital allocation, and a banking sector whose mortgage books represent an unusually large share of total lending relative to business credit. These conditions have allowed the debt-to-income ratio to climb through successive rate cycles without the kind of forced deleveraging seen in other markets.
The Australian Prudential Regulation Authority (APRA) has at various points tightened serviceability requirements and imposed caps on interest-only lending — most aggressively between 2017 and 2019 — producing a mild correction in Sydney and Melbourne before the pandemic-era stimulus reignited price growth. The current environment, with 18 lenders cutting variable mortgage rates ahead of any RBA movement, suggests that competitive pressure within the banking sector is again loosening credit conditions at the margin — precisely the dynamic that preceded debt acceleration phases in Denmark and Canada.
For broader Australian property market context, including transaction-level data and regional price trends, the current lending environment warrants close attention: rate competition among banks does not reduce the debt burden households carry — it increases the volume of debt they can service at a given income level, which is the mechanism through which debt-to-income ratios climb further.
When Debt Stops Growing: The Most Dangerous Phase
Historical analysis of property crashes consistently identifies the period immediately following peak debt growth as the highest-risk window. This is counterintuitive: prices often continue rising for an extended period after the debt path begins flattening, sustained by momentum, media narratives, and the behaviour of buyers who entered the market expecting continued appreciation.
In Japan, property prices peaked in the early 1990s, roughly two years after credit growth began decelerating. In Ireland, the debt-to-income ratio for households peaked in the mid-2000s; prices did not peak until 2007 and did not collapse until 2008. In the United States, mortgage origination volumes peaked in the mid-2000s while prices continued rising for some years afterward. In each case, the lag between credit deceleration and price correction created a window of false confidence — and a larger pool of buyers who purchased near the peak.
Australia has not yet reached an unambiguous deceleration in household credit growth. But the conditions that have historically triggered that deceleration — rate sensitivity at high debt loads, regulatory intervention, or an external shock to credit supply — are present in the current environment. The current bubble risk indicators tracked by Bubblepedia reflect several of these warning signs simultaneously.
What Distinguishes Australia From the Historical Cases
Intellectual honesty requires acknowledging what makes Australia's situation structurally different from the historical parallels. Japan's crash was compounded by a broader asset bubble across equities and commercial real estate, and by a banking sector that concealed non-performing loans for years. Ireland's collapse was amplified by eurozone membership, which removed the exchange rate as a pressure valve. Denmark's correction was severe but ultimately contained by a social safety net and labour market flexibility that prevented mass foreclosure.
Australia has a floating exchange rate, a relatively well-capitalised banking sector under APRA supervision, and a demonstrated willingness to use macroprudential tools. These are genuine buffers. They do not, however, alter the fundamental arithmetic: when household debt is at a very high multiple of income, a sustained rise in debt-servicing costs — whether from rate increases, income stagnation, or unemployment — compresses consumption and eventually forces deleveraging. The historical record offers no example of a developed economy that sustained a debt-to-income ratio at this level through a full rate cycle without a material correction in either prices or economic activity.
The path, not the level, is what to watch. And the path, across every comparable historical episode, has eventually turned.