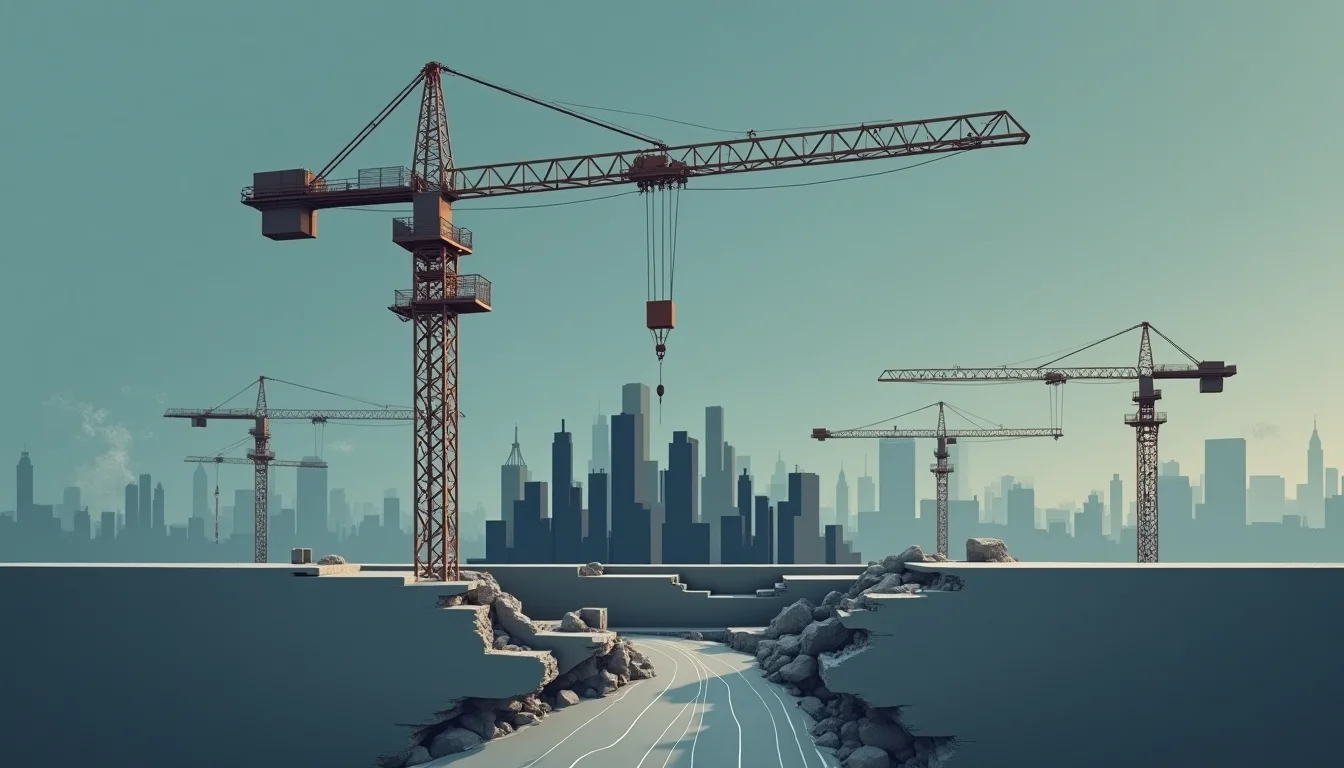
In the years before Ireland's property market collapsed in 2008, residential construction alone accounted for roughly 13 percent of the country's GDP — a concentration that, in retrospect, made the subsequent crash not merely a housing correction but a sovereign fiscal emergency. According to the Bubblepedia Irish Property Bubble entry, at the peak of the Celtic Tiger boom, one in eight Irish workers was employed directly in construction, with a further layer of dependent employment in finance, real estate services, and materials supply. When the sector contracted, it did not simply reduce output — it fractured the entire economic structure that had been built around it.
Australia in 2026 has not reached Irish proportions. But the structural logic that made Ireland so vulnerable — an economy increasingly organised around the production and financing of residential property — is worth examining with care, because the warning signs are not difficult to find.
What Construction-GDP Dependency Actually Measures
The ratio of residential construction activity to gross domestic product is, on its own, an incomplete indicator. What matters is the degree of dependency: how much of aggregate employment, household income, consumer spending, and government revenue is directly or indirectly contingent on the construction sector continuing to expand. When that dependency deepens over years, the economy loses the structural flexibility needed to absorb a sectoral downturn without broader contagion.
Spain offers an equally instructive case. According to the Bubblepedia Spanish Property Bubble entry, at the height of Spain's building boom in 2006 and 2007, construction accounted for approximately 10 percent of GDP and employed close to 14 percent of the workforce — a figure that reflected not just housebuilders but the vast web of trades, suppliers, and local government finances that depended on stamp duties and development levies. When Spanish housing starts collapsed after 2008, unemployment rose to over 26 percent by 2013, a rate that cannot be explained by the housing correction alone but reflects precisely this cascading dependency.
Japan's experience in the early 1990s adds a third data point. The unwinding of Japan's property bubble did not produce immediate mass unemployment in construction — Japanese corporate culture and government stimulus delayed that reckoning — but it did produce what economists came to call the "Lost Decade": a prolonged period of deflationary stagnation driven in part by the impairment of bank balance sheets and the collapse of investment in an economy that had been heavily oriented toward property asset accumulation. For a direct comparison of Japan's property collapse and the 2008 US housing crisis, the structural parallels in bank exposure and GDP dependency are striking.
Australia's Structural Position
Australia's residential construction sector has, over the past two decades, become deeply embedded in the broader economy in ways that extend well beyond simple output measures. The Australian Bureau of Statistics has consistently reported that construction is among the largest employing industries in the country, with the residential sub-sector representing a substantial share of that total. State government revenues — particularly in New South Wales, Victoria, and Queensland — have become materially dependent on property transaction taxes, development contributions, and stamp duties, creating a fiscal feedback loop that amplifies boom conditions and can accelerate stress in downturns.
The household wealth dimension compounds this structural exposure. For the majority of Australian households, the primary residence represents the dominant asset on the balance sheet. This means that a sustained decline in property values does not merely affect developers and lenders — it affects household consumption through negative wealth effects, retirement planning through superannuation and self-managed fund property holdings, and small business lending through the collateral values that underpin many commercial loans.
For a broader view of how these dynamics interact with interest rate cycles and credit availability, the Australian property market context has been tracking the convergence of rate pressure, valuation stress, and construction pipeline uncertainty in real time.
The Pipeline Problem
One of the more telling structural features of the current Australian situation is the tension between a politically mandated construction pipeline — governments at federal and state level have committed to ambitious housing supply targets — and the financial conditions that make those targets increasingly difficult to meet. Higher interest rates raise the cost of project finance for developers. Labour and materials cost inflation has compressed margins on new projects. And pre-sales requirements, which lenders use to de-risk construction loans, have become harder to satisfy in an environment of buyer caution.
This dynamic is not new. Ireland and Spain both experienced late-cycle periods where official rhetoric about housing supply remained expansionary even as the financial conditions underpinning new construction were quietly deteriorating. The political commitment to building more homes can mask the leading indicators of sectoral stress — particularly when those indicators are embedded in private lending conditions and developer balance sheets rather than in publicly reported statistics.
When an economy's fiscal revenues, household wealth, employment base, and political narrative all depend on construction remaining buoyant, the sector is no longer a component of the economy — it has become the economy's load-bearing wall. History is unambiguous about what happens when that wall develops cracks.
What Differentiates a Correction from a Crisis
Not every property downturn produces an economic crisis. The United States in 2008 was severe; Australia's correction in 2017–2019 was manageable. The differentiating factors typically include: the degree of leverage in the system, the concentration of bank lending in residential mortgages, the share of GDP dependent on construction activity, and the speed at which credit conditions tighten. Current bubble risk indicators across the Australian property market suggest that several of these factors are moving in an unfavourable direction simultaneously.
The historical record, reviewed across the full Bubblepedia bubble encyclopedia, consistently shows that construction-GDP dependency is not merely a symptom of a property bubble — it is one of its most reliable amplifiers. Countries that allowed their economies to become structurally dependent on residential construction found that the correction, when it came, was not proportional to the initial imbalance. It was larger, longer, and more damaging than the headline property price decline suggested it would be.
Australia's policymakers, lenders, and investors would do well to study that record with the seriousness it deserves — not because a crash is inevitable, but because the structural conditions that made previous crashes so costly are present in recognisable form.
See also: Spanish Property Bubble vs Irish Property Bubble — Two European Crashes Compared.
See also: Australian Property Bubble vs US Housing Bubble 2008 — Why One Crashed and One Did Not.