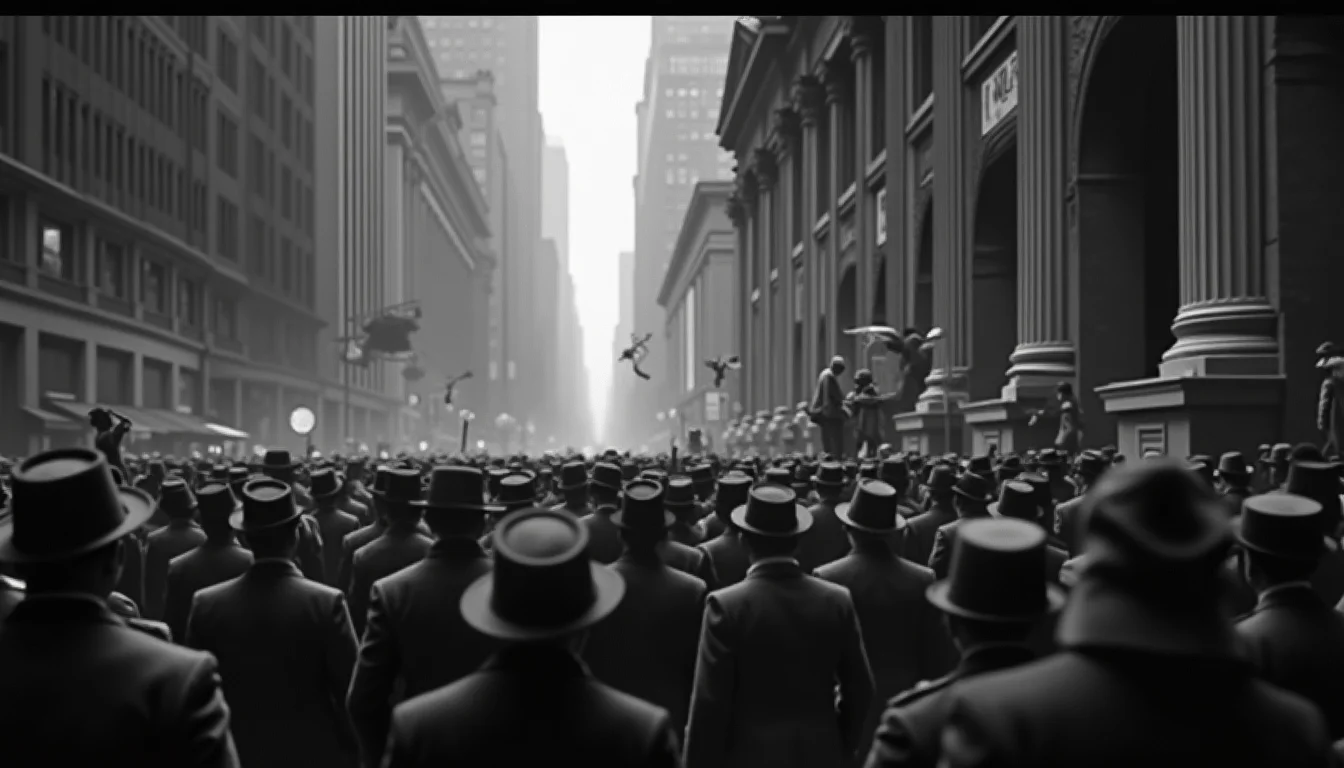
Wall Street Crash and the Roaring Twenties (1924-1929)
The most devastating stock market crash in history. The Dow fell 89% from peak to trough, triggering the Great Depression that lasted a decade.
By Twin · @TwinTowerCity·
Key Takeaways
- →The 1920s stock market bubble peaked in 1929 as one of history's most devastating financial crashes.
- →Excessive leverage allowing investors to buy stocks with only 10% down payment fueled the speculative mania.
- →The Wall Street Crash began in October 1929, triggering a catastrophic market collapse within days.
- →The Dow Jones fell 89% from peak to trough, destroying wealth and triggering the decade-long Great Depression.
- →The crash proved that extreme leverage amplifies losses catastrophically, making financial systems inherently fragile.
Peak Year
1929
Crash Year
1929
Location
United States / Global
Asset Class
Equities
Severity
The Roaring Twenties Boom
The 1920s saw unprecedented economic expansion in the United States. Industrial production nearly doubled between 1921 and 1929, automobile ownership surged, and new consumer technologies — radio, electrical appliances, motion pictures — transformed daily life. Real GDP grew at approximately 4.2% annually throughout the decade, fuelling widespread optimism about permanent prosperity.
The stock market became a vehicle for mass participation in this growth. The Dow Jones Industrial Average rose from 63 points in August 1921 to a peak of 381 points on 3 September 1929 — a roughly 500% increase. Margin lending made stocks accessible to ordinary Americans: brokers required only 10–20% down payment, with the remainder borrowed. By mid-1929, brokers' loans had reached $8.5 billion, roughly equal to the entire amount of currency circulating in the United States at the time.
Warning Signs Ignored
Several warning indicators were evident before the crash. The Federal Reserve had raised the discount rate from 3.5% to 5% in mid-1928, concerned about speculative excess. Agricultural prices had been declining since 1926, squeezing rural banks. Construction spending peaked in 1926 and declined steadily. Industrial production began slowing in June 1929, and automobile sales weakened months before the crash.
Despite these signals, prominent figures reinforced market confidence. Yale economist Irving Fisher famously declared in October 1929 that stocks had reached 'a permanently high plateau.' Investment trusts — the era's equivalent of leveraged funds — proliferated, with over 500 created in 1929 alone, many investing primarily in each other's shares.
The Crash (October 1929)
The market began declining in late September. On 'Black Thursday,' 24 October, panic selling saw approximately 12.9 million shares traded — nearly three times the normal volume. A consortium of major bankers, led by Thomas Lamont of J.P. Morgan, briefly stabilised prices by purchasing large blocks of stock.
The respite was temporary. On 'Black Monday,' 28 October, the Dow fell 12.8%, and on 'Black Tuesday,' 29 October, it dropped another 11.7% on record volume of approximately 16.4 million shares. The ticker tape fell hours behind actual trading, amplifying panic as investors could not determine current prices. By mid-November 1929, the Dow had fallen to 198 — a decline of roughly 48% from its September peak.
The Long Decline
The initial crash was only the beginning. After a partial recovery in early 1930, the market resumed its decline as the broader economy contracted. Bank failures cascaded — over 9,000 banks failed between 1930 and 1933, wiping out depositors' savings in an era before deposit insurance. The Dow eventually bottomed at 41.22 on 8 July 1932, representing an 89% decline from the 1929 peak.
The crash catalysed the Great Depression, the worst economic downturn in modern history. US unemployment rose from approximately 3% in 1929 to 25% by 1933. Real GDP contracted by roughly 30% between 1929 and 1933. Industrial production fell by approximately 47%. The economic devastation spread globally through trade and financial linkages, contributing to political instability in Europe.
Regulatory Response and Legacy
The crash and subsequent Depression produced fundamental reforms to the American financial system. The Securities Act of 1933 and Securities Exchange Act of 1934 established the Securities and Exchange Commission (SEC) and mandated disclosure requirements for publicly traded companies. The Banking Act of 1933 (Glass-Steagall) separated commercial and investment banking. The Federal Deposit Insurance Corporation (FDIC) was created to protect depositors.
Margin requirements were subsequently raised to 50% and placed under Federal Reserve control. These reforms shaped financial regulation for decades and established the principle that securities markets require active government oversight. The 1929 crash remains the benchmark against which all subsequent market crashes are measured, and its lessons about leverage, speculation, and regulatory failure continue to inform economic policy.
The Decade of Speculation Behind the Crash
The 1929 crash is usually framed as a sudden event, but it was the culmination of a nine-year boom that had transformed both the structure of American equity ownership and the leverage embedded in the system. From 1921 to September 1929, the Dow Jones Industrial Average rose from 63 to 381, a 505% gain. More telling than the price level was the change in who was buying. In 1921, fewer than half a million Americans owned stocks directly. By 1929, the figure was somewhere between 1.5 and 3 million depending on the survey, and brokerage offices had spread from Wall Street into department-store basements, hotel lobbies, and rural railway stations. Margin loans — money borrowed from a broker to buy stock — rose from $1 billion in 1921 to over $8.5 billion by September 1929, equivalent to roughly 8% of US GDP at the time.
The standard margin requirement during the late boom was 10%. A speculator with $1,000 of capital could control $10,000 of stock; a 10% decline in the underlying would wipe him out and trigger a forced sale. Brokers could and did issue margin calls at any time, and increasingly did so on telegraphic notice, demanding payment within hours. This created the precondition for a self-reinforcing collapse: any sharp decline would generate forced selling, which would deepen the decline, which would trigger more margin calls. It was a structurally unstable system that required only a sufficient initial shock to detonate.
Compounding the leverage problem, the late 1920s saw the explosive growth of investment trusts — pooled vehicles that themselves bought stocks on margin and were then sold to retail investors. By 1929, investment trusts held roughly $8 billion in assets, much of it in other investment trusts (pyramiding leverage on leverage in a structure that economist John Kenneth Galbraith later compared to "a financial daisy chain"). Goldman Sachs Trading Corporation, the Shenandoah Corporation, and the Blue Ridge Corporation were the most notorious of these vehicles; all three lost more than 95% of their value within three years.
Black Thursday, Black Monday, Black Tuesday
The mechanics of the crash itself unfolded over five trading days. Thursday, 24 October 1929 opened with heavy selling that overwhelmed the ticker tape, which fell more than two hours behind by midday. By 11 a.m., crowds had gathered outside the New York Stock Exchange. The Dow fell 11% intraday before a consortium of bankers led by Thomas Lamont of J.P. Morgan organised a public buying programme that pushed the index back to a closing loss of just 2%. The intervention was widely reported as a successful rescue, and the market closed Friday and Saturday largely flat.
Confidence collapsed over the weekend. Monday, 28 October opened with no organised buying support, and the Dow fell 13% in a single session — at the time the largest one-day percentage decline in history. Tuesday, 29 October was worse: 16.4 million shares traded (a record not broken until 1968) and the index fell another 12%. By the closing bell on Tuesday, the Dow had lost roughly 25% in two sessions and 39% from its September peak. Margin calls cascaded. Brokers seized collateral. Investment trusts were forced to dump positions into a market with no bid.
The destruction continued in waves through 1932, when the Dow finally bottomed at 41 — an 89% decline from the 1929 peak, a level not surpassed in real terms until 1954.
The Federal Reserve's Catastrophic Policy Failure
Milton Friedman and Anna Schwartz's A Monetary History of the United States (1963) is the definitive critique of what the Federal Reserve did wrong between 1929 and 1933. Their argument, broadly accepted today, is that the crash itself need not have caused the Great Depression. What turned a sharp recession into a decade-long catastrophe was the Federal Reserve's failure to provide adequate liquidity to a banking system experiencing successive waves of runs. Between 1930 and 1933, roughly 9,000 American banks failed, wiping out an estimated $7 billion in deposits — more than 5% of national income. The money supply contracted by approximately one-third.
The Fed's behaviour during this period reflected a doctrinal commitment to the "real bills" theory and a fear of speculation that survived the 1929 crash itself. Several regional Reserve Banks, particularly New York, urged aggressive open-market purchases to inject reserves; the Federal Reserve Board in Washington overruled them repeatedly. By the time the Fed reversed course in 1932 with a $1 billion bond-buying programme, the contraction had built its own momentum.
"The Great Contraction is in fact a tragic testimonial to the importance of monetary forces. The Federal Reserve System was set up specifically to prevent what happened. It failed not because the tools did not exist but because the people running the system did not understand what they had."
— Milton Friedman and Anna Schwartz, 1963
The Modern Parallel — Leverage in Any Era
The structural lesson of 1929 is not about stocks; it is about leverage embedded in a system that participants believe is safe. The 1920s margin investor saw 10:1 leverage as ordinary because the market had risen for nine years. The 2007 mortgage holder saw 95% loan-to-value ratios as ordinary because house prices had risen for ten. The 2021 crypto trader saw 25x perpetual futures as ordinary because Bitcoin had risen for eighteen months. In each case, the leverage was visible to anyone who looked, but the participants discounted the risk because the recent record made the leverage feel comfortable.
The modern equivalents of 1929's investment trusts are not hard to identify: leveraged ETFs, retail-accessible options, prime-broker-financed hedge funds, and the still-opaque private credit market. None of these are inherently dangerous. What makes them dangerous is the same condition that made 1929 dangerous: a long bull market that has trained an entire generation of participants to believe that drawdowns will be brief and recoveries automatic. See also US Equity Markets — Are Valuations at Bubble Levels? for current valuation context.
Recommended Reading

Key Statistics
Dow Peak to Trough
381 to 41 (-89%)
Recovery Time
25 years (to Nov 1954)
Margin Requirement
Just 10%
Bank Failures (1930–33)
~9,000
Peak Unemployment
25%
GDP Decline
30%
Warning Signs
- 90% margin lending enabling massive leverage on stocks
- Prominent economists declaring permanent prosperity
- Layered leverage through investment trusts
- Speculative participation across all social classes
- Florida land bust of 1926 providing early warning
Timeline
1921
Dow Jones at 63 — post-war recovery begins
1927
Federal Reserve cuts rates, accelerating speculation
Sep 1929
Dow peaks at 381 — Irving Fisher declares 'permanent plateau'
24 Oct 1929
Black Thursday — 12.9 million shares traded in panic
29 Oct 1929
Black Tuesday — 16.4 million shares, market collapses
Jul 1932
Dow bottoms at 41.22 — 89% decline from peak
Nov 1954
Dow finally recovers to 1929 levels — 25 years later
Lessons Learned
The 1929 Crash teaches the supreme lesson of all financial bubbles: leverage kills. When investors can buy assets with 90% borrowed money, the amplification of both gains and losses creates a system that is inherently fragile. The crash also demonstrates that expert opinion provides no protection — the most respected economists of the era were the most bullish at the peak. The regulatory response created enduring protections, but the gradual erosion of those protections (repeal of Glass-Steagall in 1999) contributed to the 2008 crisis.
Frequently Asked Questions
What caused the 1929 Wall Street Crash?
The 1929 crash was caused by excessive speculation, widespread margin buying (purchasing stocks with borrowed money), overvaluation of stocks, and insufficient regulation. Banks were heavily invested in the stock market, and when prices began falling, margin calls forced massive selling. The Federal Reserve's tight monetary policy and economic inequality also contributed to the bubble's collapse.
How much did the stock market fall during the 1929 crash?
The Dow Jones Industrial Average fell 89% from its September 1929 peak of 381 to its July 1932 trough of 41. The initial crash occurred over several days in late October 1929, with the market losing approximately 25% of its value. However, the full decline continued for nearly three years during the Great Depression.
What were the warning signs before the 1929 stock market crash?
Warning signs included extremely high price-to-earnings ratios, rampant speculation in stocks by ordinary citizens, widespread margin buying with up to 90% borrowed funds, and the Florida real estate bubble burst in 1926. Economic indicators showed declining industrial production and rising unemployment months before the crash, yet stock prices continued climbing.
What lessons does the 1929 Wall Street Crash teach investors?
Key lessons include avoiding excessive leverage and margin buying, recognizing that markets can remain irrational but eventually correct, diversifying investments beyond just stocks, and understanding that widespread euphoria often signals bubble peaks. The crash also demonstrated the importance of financial regulation and the dangers of banks speculating with depositor funds.
Current Relevance
With the Shiller CAPE ratio at levels seen only twice before in history (1929 and 2000), the lessons of the Wall Street Crash are acutely relevant. Modern markets feature different forms of leverage (options, leveraged ETFs, margin trading) but the fundamental dynamic — borrowed money amplifying speculation — remains unchanged.
Explore gold storage options
Gold is not a guaranteed hedge against crashes. Prices can fall; storage fees and custody risks also matter.
Affiliate link: Bubblepedia may earn a commission. Not a recommendation; investment values can fall.
Recommended Reading
Recent Analysis
India's $5.4 Trillion Stock Market Surge: Foreign Inflows Reclaim Fifth-Largest Position
12 Nov 2026
Anthropic's $1.4 Trillion Nasdaq Debut: When AI Unicorns Meet Historical IPO Mania
11 Nov 2026
US Chipmakers in Technical Correction Amid Oil Plunge
3 Nov 2026
Anthropic's Nasdaq IPO: AI Startup's Historic Public Debut
2 Nov 2026
Morgan Stanley: S&P 500 9% Dip Offers Buying Opportunity
1 Nov 2026
Get Bubblepedia in your inbox
Asset bubbles and market-history insights in your inbox.