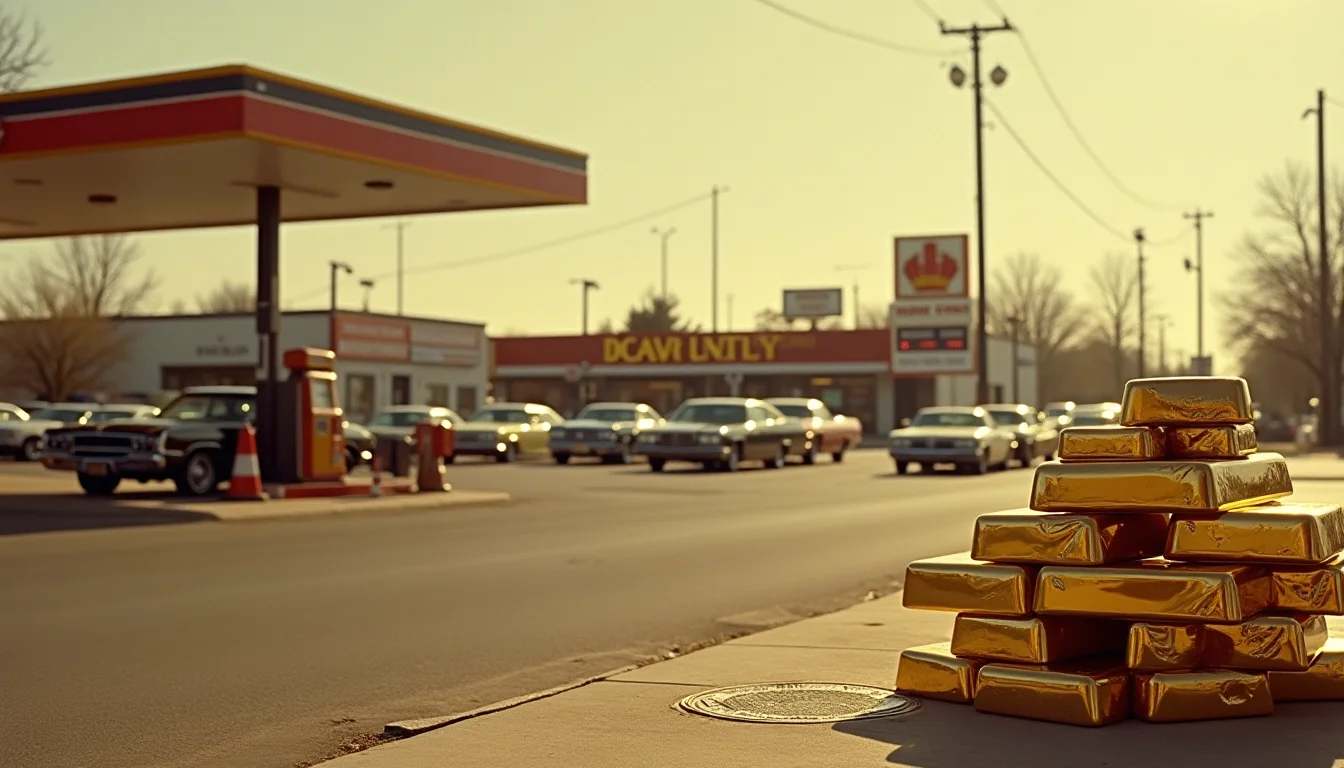
1970s Commodity Super-Cycle
The 1970s commodity super-cycle saw gold rise from $35/oz to $850/oz, silver squeeze to nearly $50/oz under the Hunt brothers, and oil quadruple following the OPEC embargo. Stagflation, a collapsing dollar after Bretton Woods, and a generational loss of faith in paper money drove a decade-long inflationary boom that ended only when Volcker's Federal Reserve pushed real interest rates to historic highs.
By Twin · @TwinTowerCity·
Key Takeaways
- →Gold prices surged 2,300% from $35 to $850 per ounce during the 1970s commodity super-cycle peak.
- →The collapse of Bretton Woods in 1971 and resulting dollar devaluation triggered massive flight to hard assets.
- →Paul Volcker's interest rate hikes to 20% in 1980-1981 broke the commodity boom and triggered severe recession.
- →The Hunt brothers' silver manipulation collapsed in 1980, causing billions in losses and margin call chaos.
- →Extreme monetary policy changes can create decade-long asset bubbles requiring equally extreme measures to resolve.
Peak Year
1980
Crash Year
1981
Location
Global
Asset Class
Commodities
Severity
The Post-Bretton Woods Commodity Explosion
The supercycle's origins trace directly to President Nixon's August 15, 1971 decision to suspend dollar convertibility into gold, effectively ending the Bretton Woods system. This "Nixon Shock" triggered immediate dollar devaluation and introduced floating exchange rate uncertainty that would persist for the remainder of the decade. Commodity markets, priced predominantly in dollars, became the primary beneficiary of this monetary upheaval. The Reuters-CRB Commodity Index surged approximately 50% between 1971 and 1973, well before the Arab oil embargo that would define the crisis. Agricultural products led the initial charge, with wheat futures rising from $1.35 per bushel in August 1971 to over $6.00 by early 1974. Copper, crucial for industrial expansion, climbed from $0.45 per pound to $1.52 over the same period.The 1973 Arab Oil Embargo
The Yom Kippur War's outbreak on October 6, 1973 transformed a manageable commodity rally into a global crisis. Within days, Arab oil producers announced production cuts targeting countries supporting Israel, particularly the United States and Netherlands. OPEC's coordinated action removed approximately 4 million barrels per day from global supply, roughly 7% of world production at the time. Oil prices erupted from around $3 per barrel in September to over $12 by December 1973, a fourfold increase that sent shockwaves through the global economy. The crisis's physical manifestations became immediately visible: speed limits reduced to 55 mph across America, Sunday driving bans in several states, and gasoline rationing systems reminiscent of World War II.The oil shock revealed the extent to which modern industrial economies had become dependent on cheap energy. Every production process, from agriculture to manufacturing, faced simultaneous cost increases that could not be easily absorbed or passed through. This marked the beginning of what economists would later term "stagflation" — the combination of stagnant growth and accelerating inflation that conventional Keynesian theory suggested was impossible.Beyond energy, the embargo triggered secondary effects across commodity markets. Transportation costs soared, affecting everything from grain shipments to manufactured goods. Industrial metals faced both higher production costs and reduced demand as recession fears mounted. The dollar's continued weakness amplified price increases for countries dependent on commodity imports. The economic disruption proved more severe than anticipated. US industrial production fell 15% from its 1973 peak to the 1975 trough, while unemployment doubled from 4.9% to 9.0%. Yet inflation continued accelerating, reaching 12.3% by December 1974, breaking the presumed inverse relationship between employment and price levels that had guided policy for decades.
The Second Oil Shock and the Hunt Brothers
Just as commodity markets began stabilizing in the late 1970s, a second oil shock emerged from Iran's 1979 revolution. The overthrow of Shah Mohammad Reza Pahlavi in January 1979 removed 5-6% of world oil supply virtually overnight, as production fell from 6 million to under 1 million barrels per day during the crisis. Oil prices rocketed from approximately $13 per barrel in early 1979 to over $34 by 1980. The Soviet invasion of Afghanistan in December 1979 added a geopolitical risk premium, as markets feared further Middle Eastern instability. This second shock proved more damaging than the first, as it struck economies already weakened by persistent inflation and reduced their capacity to absorb further price increases. Simultaneously, the silver market experienced its own speculative frenzy orchestrated by Texas oil heirs Nelson Bunker Hunt and William Herbert Hunt. Beginning in 1979, the Hunt brothers accumulated approximately 200 million ounces of physical silver and silver futures — roughly one-third of world annual production. Their strategy aimed to corner the global silver market during a period of perceived monetary instability.| Aspect | 1973 Oil Shock | 1979 Oil Shock |
|---|---|---|
| Trigger | Arab-Israeli War, OPEC embargo | Iranian Revolution, production collapse |
| Supply Removed | 4 million bpd (7% of global) | 5 million bpd (8% of global) |
| Peak Price | $12/barrel (from $3) | $39/barrel (from $13) |
| Duration High Prices | 18 months | 24 months |
| Recession Depth | -3.2% GDP, 9% unemployment | -2.5% GDP, 10.8% unemployment |
| Fed Response | Accommodative (Burns era) | Tightening (Volcker era) |
On March 27, 1980 — subsequently known as "Silver Thursday" — the Hunt brothers faced margin calls exceeding $100 million as silver prices collapsed from $21 to under $11 in a single trading session. Their combined losses approached $1 billion, forcing them into bankruptcy and demonstrating the limits of even the wealthiest speculators when confronting regulatory intervention and market forces simultaneously.
Gold's Parabolic Rise and Collapse
Gold's performance during the 1970s supercycle represented perhaps the most dramatic asset price movement in modern financial history. From the official Bretton Woods price of $35 per ounce, gold climbed relentlessly to an intraday peak of $850 on January 21, 1980 — a gain of approximately 2,330% over nine years. Multiple factors drove gold's ascent beyond monetary considerations alone. Dollar weakness following Nixon's devaluation created initial upward pressure, but subsequent events amplified the rally. The Soviet invasion of Afghanistan in December 1979 heightened Cold War tensions, while the Iranian hostage crisis that began in November 1979 created persistent geopolitical uncertainty. Double-digit inflation rates made gold appear essential for wealth preservation. The rally's parabolic phase began in 1979, with gold rising from $200 to over $800 in just 18 months. This acceleration exhibited classic bubble characteristics: media coverage intensified, retail investors entered the market, and gold became a popular conversation topic at social gatherings. Coin shops reported hours-long queues as ordinary citizens sought protection against currency debasement.The Volcker Solution and Commodity Deflation
Paul Volcker's appointment as Federal Reserve Chairman in August 1979 marked the beginning of the supercycle's end. Volcker recognized that sustained inflation had become embedded in economic expectations, requiring dramatic monetary tightening to restore price stability. His approach would prove both economically effective and politically costly. The Federal Reserve raised the federal funds rate to over 20% by June 1981, creating the highest real interest rates in modern American history. This monetary shock induced the severest recession since the 1930s, with unemployment reaching 10.8% in December 1982. However, the policy successfully broke the inflation spiral that had dominated the previous decade."The standard of living of the average American has to decline. I don't think you can escape that," Volcker stated in 1979, acknowledging the painful adjustment necessary to restore monetary stability. His willingness to accept short-term economic damage to achieve long-term price stability represented a fundamental shift from the accommodative policies that had enabled the commodity supercycle.Commodity prices collapsed across the board as recession reduced demand while high interest rates made carrying inventory prohibitively expensive. Oil fell from $34 per barrel in 1981 to under $10 by 1986, as recession reduced consumption while new North Sea and Alaskan supplies came online. Agricultural commodities experienced similar declines, with wheat falling from over $4 per bushel to under $2.50. The commodity bust created its own crisis through the "petrodollar recycling" problem. Oil-exporting countries had deposited their 1970s windfall profits in Western banks, which had lent heavily to Latin American governments assuming continued high commodity prices. When prices collapsed, countries like Mexico, Brazil, and Argentina faced simultaneous current account and debt crises, requiring extensive International Monetary Fund intervention.
Lessons for Modern Investors
The 1970s supercycle provides the essential template for understanding sustained commodity inflation, requiring the simultaneous presence of monetary accommodation, supply shocks, and genuine physical scarcity. When any element is missing, commodity rallies tend to be shorter-lived and less severe. The 2021-2023 commodity surge exhibited partial similarities to the 1970s experience. Energy prices spiked following Russia's Ukraine invasion, supply chain disruptions affected multiple markets, and massive monetary stimulus had created excess liquidity. However, central bank responses differed markedly from the Burns era, with aggressive tightening beginning in 2022 rather than years of accommodation. Gold's 1970s performance also challenges simplistic "inflation hedge" narratives. While gold rose dramatically during 1970s inflation, it remained flat during the 1980s inflation episodes and actually gained during the 2000s deflationary period. This suggests that gold responds more to real interest rates, currency instability, and geopolitical stress than to inflation alone.Recommended Reading

Lessons Learned
Frequently Asked Questions
What caused the 1970s commodity bubble?
The 1970s commodity bubble was triggered by multiple factors: the collapse of the Bretton Woods system in 1971 which weakened the dollar, the 1973 OPEC oil embargo that quadrupled oil prices, widespread stagflation, and declining confidence in fiat currencies. Investors fled paper money for hard assets like gold, silver, and commodities as inflation hedges.
How high did gold and silver prices rise during the 1970s commodity bubble?
Gold prices skyrocketed from $35 per ounce in 1970 to a peak of $850 per ounce in January 1980, representing a 2,300% increase. Silver reached nearly $50 per ounce during the Hunt brothers' corner attempt in 1979-1980, up from around $2 per ounce at the decade's start.
What were the warning signs of the 1970s commodity bubble peak?
Key warning signs included extreme speculative behavior like the Hunt brothers' silver manipulation, double-digit inflation rates exceeding 13%, widespread hoarding of precious metals by retail investors, and commodity prices disconnecting from industrial demand fundamentals. Media coverage became euphoric, with predictions of gold reaching $2,000 per ounce.
What lessons does the 1970s commodity bubble teach investors?
The bubble demonstrates that even 'safe haven' assets can form speculative bubbles when driven by fear rather than fundamentals. It shows the power of monetary policy to end commodity booms, as Volcker's interest rate hikes above 15% crushed speculation. Diversification and avoiding panic buying remain crucial investment principles.
Current Relevance
Explore gold storage options
Gold is not a guaranteed hedge against crashes. Prices can fall; storage fees and custody risks also matter.
Affiliate link: Bubblepedia may earn a commission. Not a recommendation; investment values can fall.
Recommended Reading
Recent Analysis
Australian Dollar 2026 Rally Erased on RBA Rate Cuts
19 Nov 2026
Federal Reserve Signals Rate Hikes as Gold Collapses to 14-Month Low
18 Nov 2026
SEC Nvidia Probe: Disclosure Questions Shadow AI Dominance
18 Nov 2026
Gold's Rate-Hike Pivot: Why $4,000 Failed
12 Nov 2026
Australia Home Loan Originations Collapse 15.5%
11 Nov 2026
Get Bubblepedia in your inbox
Asset bubbles and market-history insights in your inbox.