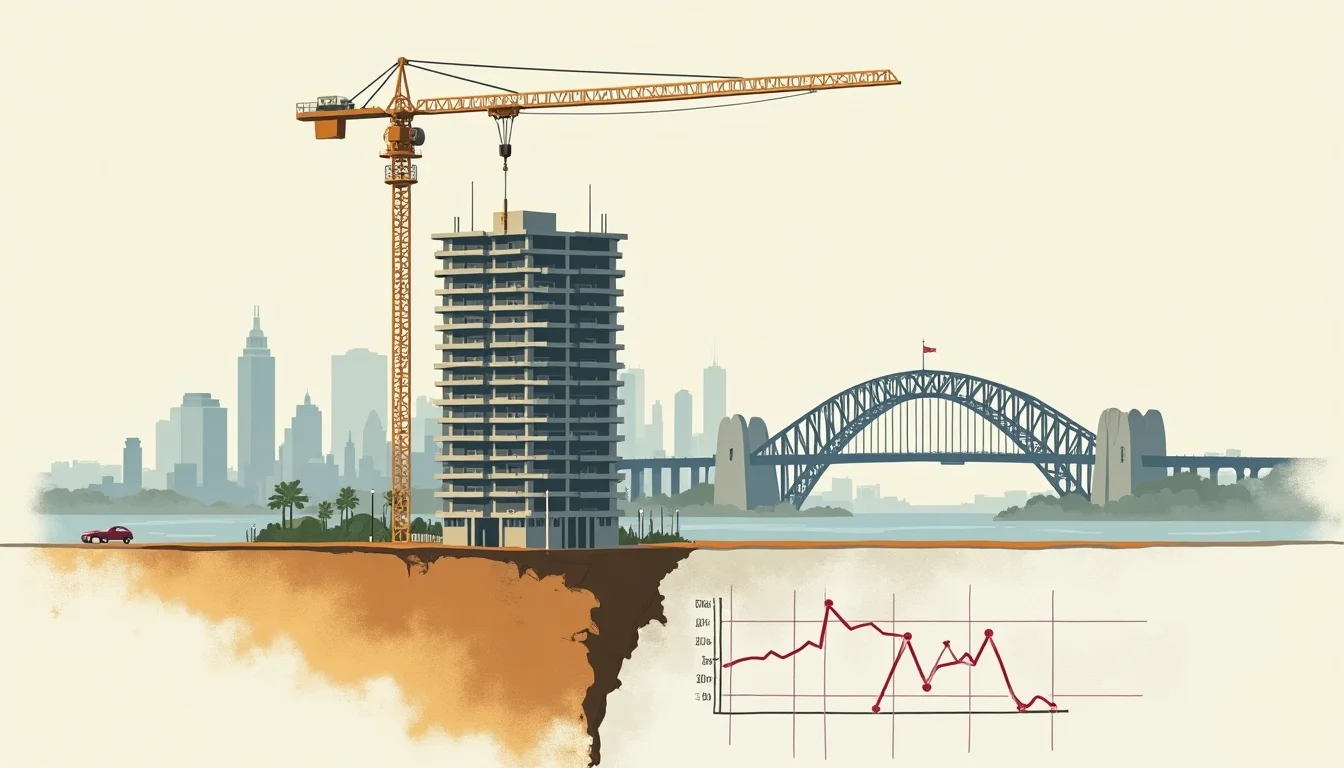
According to Bloomberg Markets, Australia's housing market is worsening — a development that, taken in isolation, might read as a cyclical correction. Taken in the context of how deeply Australia's broader economy has become structurally dependent on construction activity, it is something more consequential: the early unwinding of a GDP dependency that history has repeatedly shown ends badly.
What the Worsening Housing Data Actually Signals
The Bloomberg report does not describe a market experiencing a gentle correction. It describes a market that is worsening — a directional signal that, combined with the structural dependency described above, raises the question of second-order effects rather than first-order price moves.
The first-order question is: how much do prices fall? The second-order question — the one that determines whether a correction becomes a crisis — is: what does a sustained housing downturn do to the construction pipeline, to employment, to household balance sheets, and ultimately to the banks holding the mortgage book?
Australia's big four banks hold mortgage books that represent an unusually high proportion of their total lending relative to international peers. When housing markets weaken, the feedback loop from collateral values to bank lending appetite to new construction starts to credit availability is both well-documented and non-linear. Small price declines do not produce small credit contractions; they produce outsized caution from lenders, which accelerates the price decline, which produces further caution.
"Construction and dwelling investment booms that contribute materially to GDP growth tend to create the illusion of economic resilience — right up until the moment they don't."
— Pattern observed across Ireland 2003–2008, Spain 2004–2012, and Australia's current cycle, as documented in Bubblepedia's bubble risk indicators.
Spain followed a near-identical path. At the height of Spain's property boom, construction represented a substantial share of GDP. Spanish unemployment rose dramatically between 2007 and 2013 — a labour market catastrophe driven substantially by the collapse of construction employment. Both cases are examined in detail in the Bubblepedia bubble encyclopedia, and both share the same structural signature: an economy that had allowed a single sector to become so large that its downturn was not a sectoral problem but a national one.
Australia has not reached Irish or Spanish levels of construction concentration. But the direction of travel, the household debt ratios, and the price-to-income multiples in Sydney and Melbourne are sufficient to warrant the comparison — not as a prediction of identical outcomes, but as a framework for understanding what the tail risks look like. For broader Australian property market context, the structural dependency on construction activity has been a persistent feature of analysis for well over a decade.
The Ireland Property Bubble (2000–2008) remains the most instructive single case study for any analyst trying to understand how construction-GDP dependency transforms a property correction into a systemic event.
The Mortgage Bond Dimension
A parallel development reported by Bloomberg Markets regarding New York City's potential rent freeze and its implications for mortgage-backed securities serves as a reminder that property market stress can interact with the financial instruments built around income-producing real estate. When rental income streams become uncertain — whether through regulatory intervention, vacancy rate increases, or tenant financial stress — the securities backed by those income streams reprice. That repricing affects the balance sheets of institutions that hold them, which in turn affects their appetite for new lending, which circles back to construction finance availability.
Australia does not face a NYC-style rent freeze scenario, but the underlying dynamic is worth noting: property market stress has a habit of migrating from the asset class itself into the financial instruments built around it, and from there into the broader credit environment. Australia's residential mortgage-backed securities market is substantial, and any sustained deterioration in housing fundamentals will eventually be reflected in that market's pricing.
Where the Risk Sits Now
The combination of a worsening housing market, a workforce and GDP base heavily exposed to construction activity, household debt-to-income ratios that remain among the highest in the developed world, and a banking sector concentrated in mortgage lending creates a vulnerability profile that warrants serious attention. None of this constitutes a prediction of imminent collapse. Markets can remain stretched for longer than analysis suggests is sustainable, and Australia has a strong institutional framework and a flexible exchange rate that provide genuine buffers.
But the pattern — rising prices, construction boom, GDP dependency, price peak, worsening data — is one that Bubblepedia's historical timeline documents across multiple episodes and multiple countries. The specific trigger and timing differ each time. The underlying structure does not. Analysts and investors tracking the Japanese property bubble versus the US housing crash of 2008 will find familiar contours in the Australian data — not because the outcomes are predetermined, but because the inputs are recognisable.
The question for 2026 is not whether Australia's housing market is worsening — Bloomberg's reporting confirms that it is. The question is how much of Australia's economic growth path was, in retrospect, borrowed from a construction cycle that is now turning.
See also: Australian Property Bubble vs US Housing Bubble 2008 — Why One Crashed and One Did Not.